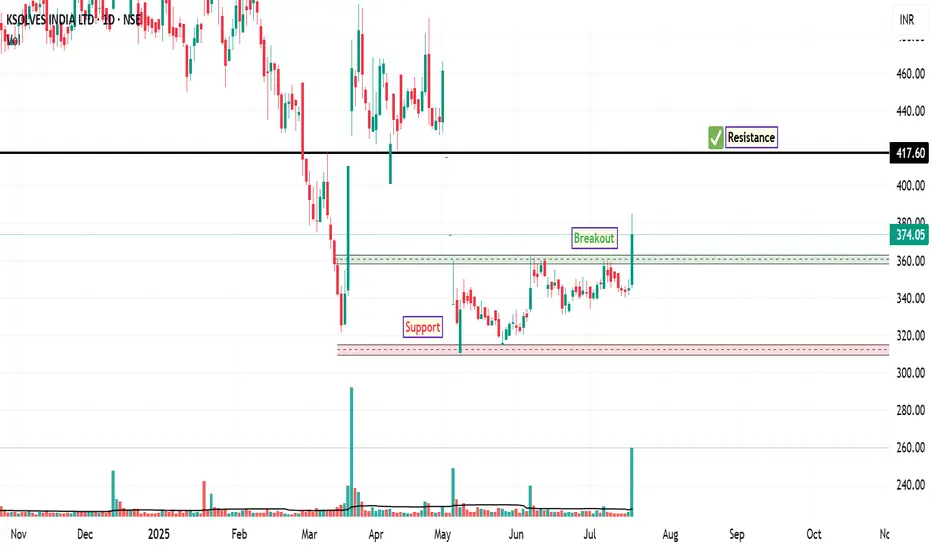
The stock of KSOLVES is currently exhibiting a notable technical setup, with key levels identified on the chart.
Support Level: The price has shown consistent buying interest around 311 indicating a strong base. This level has been tested multiple times, confirming its significance.
Breakout Level: A potential breakout is observed near 366. A decisive close above this level, accompanied by increased volume, could signal the beginning of a bullish trend continuation or reversal, depending on the broader context.
Resistance Level: The next major resistance is located at 418, which has historically acted as a ceiling for price movement. A breakout above this level could open the path for further upside momentum.
Disclaimer: The information provided in this technical analysis is for informational and educational purposes only and should not be construed as financial or investment advice. It is an interpretation of historical price data and technical indicators. Market dynamics can change, and past performance is not indicative of future results. All trading and investment activities involve substantial risk. Always conduct your own thorough due diligence and consult with a qualified financial advisor before making any investment decisions.
면책사항
이 정보와 게시물은 TradingView에서 제공하거나 보증하는 금융, 투자, 거래 또는 기타 유형의 조언이나 권고 사항을 의미하거나 구성하지 않습니다. 자세한 내용은 이용 약관을 참고하세요.
면책사항
이 정보와 게시물은 TradingView에서 제공하거나 보증하는 금융, 투자, 거래 또는 기타 유형의 조언이나 권고 사항을 의미하거나 구성하지 않습니다. 자세한 내용은 이용 약관을 참고하세요.