Technical Analysis of KSE 100 Index (15-minute timeframe) 07-10-2025
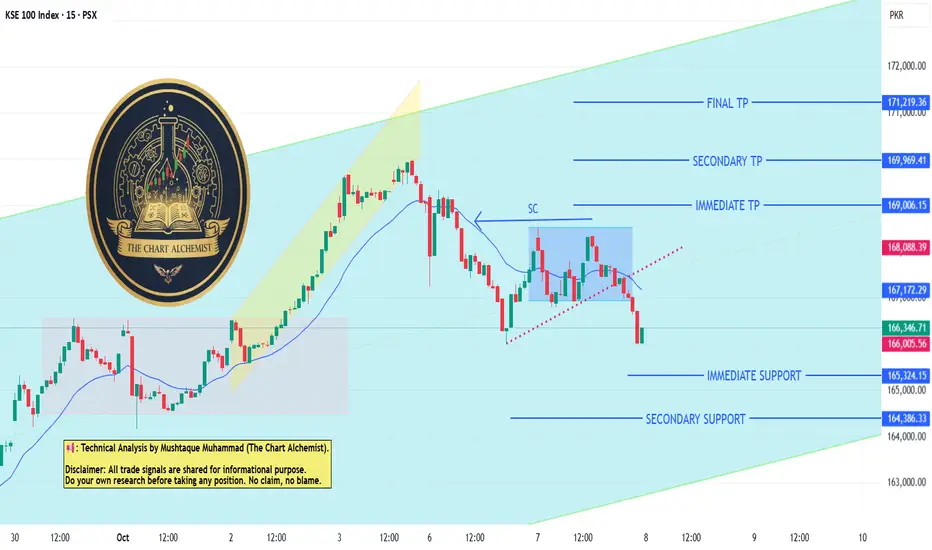
Contrary to our previous analysis, the index didn't achieve the given targets. Instead, it formed a DT Bear Flag pattern and broke down below it (marked with a red dotted line). We expect the index to continue moving lower, targeting immediate and secondary support levels at:
- 165,300
- 164,400
The index is expected to touch the bottom of the HTF (Higher Time Frame) channel before making another attempt to reverse and achieve the previously given targets.
면책사항
이 정보와 게시물은 TradingView에서 제공하거나 보증하는 금융, 투자, 거래 또는 기타 유형의 조언이나 권고 사항을 의미하거나 구성하지 않습니다. 자세한 내용은 이용 약관을 참고하세요.
면책사항
이 정보와 게시물은 TradingView에서 제공하거나 보증하는 금융, 투자, 거래 또는 기타 유형의 조언이나 권고 사항을 의미하거나 구성하지 않습니다. 자세한 내용은 이용 약관을 참고하세요.