many Chartist started to give sell call in Kotakbank..
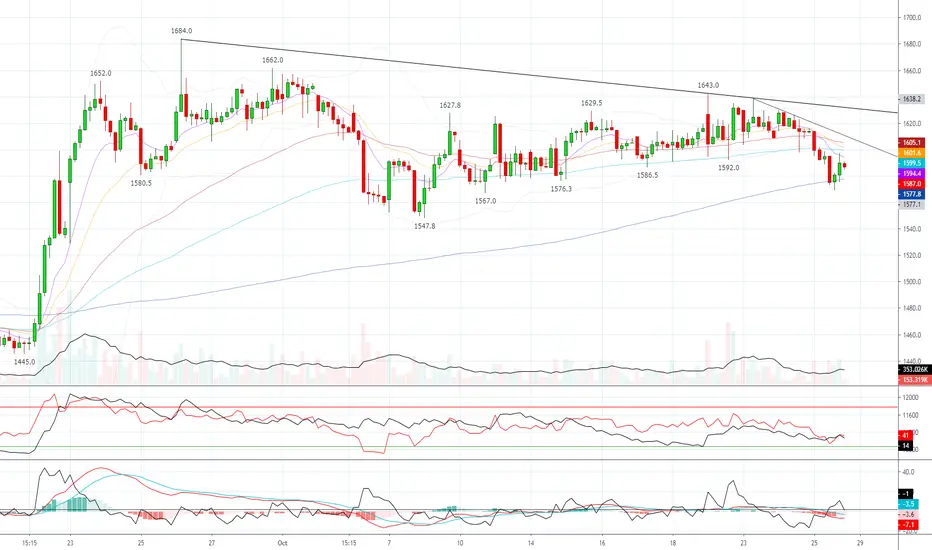
My conclusion---
1- Monthly graph given only two rate in swing high low one is upar side 1648 and 1555 in Low ( It means from the Lesting Kotak never Break its trend)
2- If any stock never break its Major trend from the listing than it not suppose to sell only buy in every deep.
3- There is two consideration in hourly graph ( Its has good support Near 1540-1560 and currently its trading 1590 so Buy above 1604 and stoploss would be 1580 closing base)
4- Buy Buy buy target will be 1648 and More
5- This is the chance to buy Kotak with stoploss and stoploss may not done if it will 1560 closing basis
액티브 트레이드
액티브 트레이드
면책사항
이 정보와 게시물은 TradingView에서 제공하거나 보증하는 금융, 투자, 거래 또는 기타 유형의 조언이나 권고 사항을 의미하거나 구성하지 않습니다. 자세한 내용은 이용 약관을 참고하세요.
면책사항
이 정보와 게시물은 TradingView에서 제공하거나 보증하는 금융, 투자, 거래 또는 기타 유형의 조언이나 권고 사항을 의미하거나 구성하지 않습니다. 자세한 내용은 이용 약관을 참고하세요.