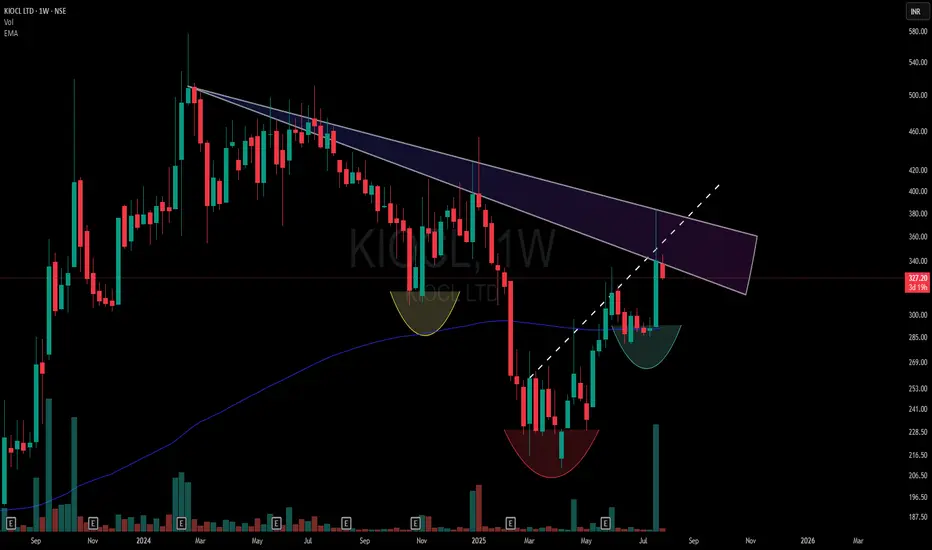
- This chart highlights a dual counter-trend resistance zone formed by two overlapping CT trendlines (marked in the shaded purple region).
🟡 Yellow Cup – Marks the origin base of the structure (assumed starting shift).
🔴 Red Cup – Establishes a Lower Low Base, still within bearish control.
🟢 Green Cup – Forms a Higher Low Base, showing a market structure change supported by a noticeable volume surge.
- The dotted trendline drawn through the zone acts as a hidden resistance confluence
⚠️ Disclaimer:
This post is non-forecasting in nature. It is not a buy/sell recommendation or financial advice. The chart is shared purely for educational and structural analysis purposes.
🎯 Master My Self-Made Trading Strategy
📈 Telegram (Learn Today): t.me/hashtaghammer
✅ WhatsApp (Learn Today): wa.me/919455664601
📈 Telegram (Learn Today): t.me/hashtaghammer
✅ WhatsApp (Learn Today): wa.me/919455664601
관련 발행물
면책사항
해당 정보와 게시물은 금융, 투자, 트레이딩 또는 기타 유형의 조언이나 권장 사항으로 간주되지 않으며, 트레이딩뷰에서 제공하거나 보증하는 것이 아닙니다. 자세한 내용은 이용 약관을 참조하세요.