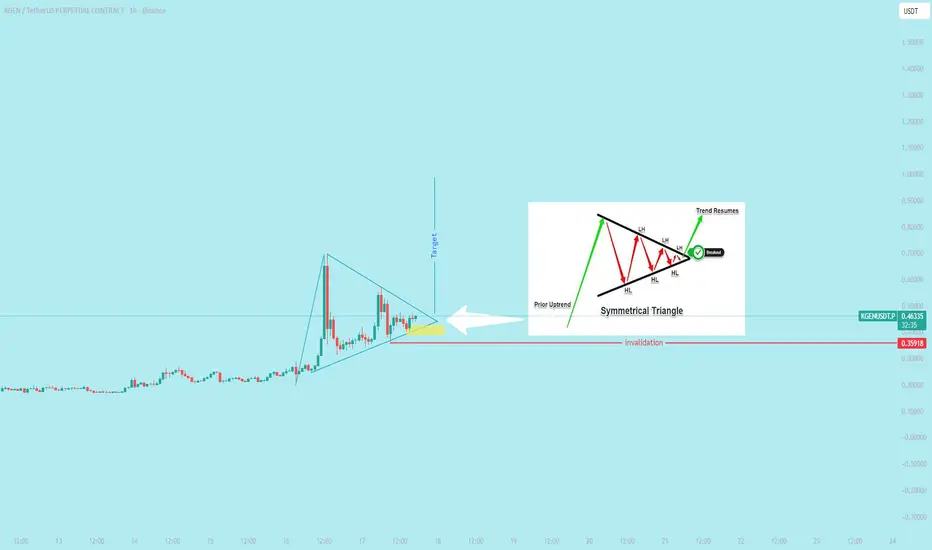
A bullish symmetrical triangle is a continuation pattern that signals a potential resumption of an uptrend. The pattern forms during a period of market indecision, where the price consolidates between a descending upper trendline and an ascending lower trendline. A confirmed breakout above the upper trendline suggests that buyers have regained control and the upward momentum is likely to continue.
면책사항
이 정보와 게시물은 TradingView에서 제공하거나 보증하는 금융, 투자, 거래 또는 기타 유형의 조언이나 권고 사항을 의미하거나 구성하지 않습니다. 자세한 내용은 이용 약관을 참고하세요.
면책사항
이 정보와 게시물은 TradingView에서 제공하거나 보증하는 금융, 투자, 거래 또는 기타 유형의 조언이나 권고 사항을 의미하거나 구성하지 않습니다. 자세한 내용은 이용 약관을 참고하세요.