Technical Analysis (Daily Timeframe) by Blaž Fabjan
Chart Pattern
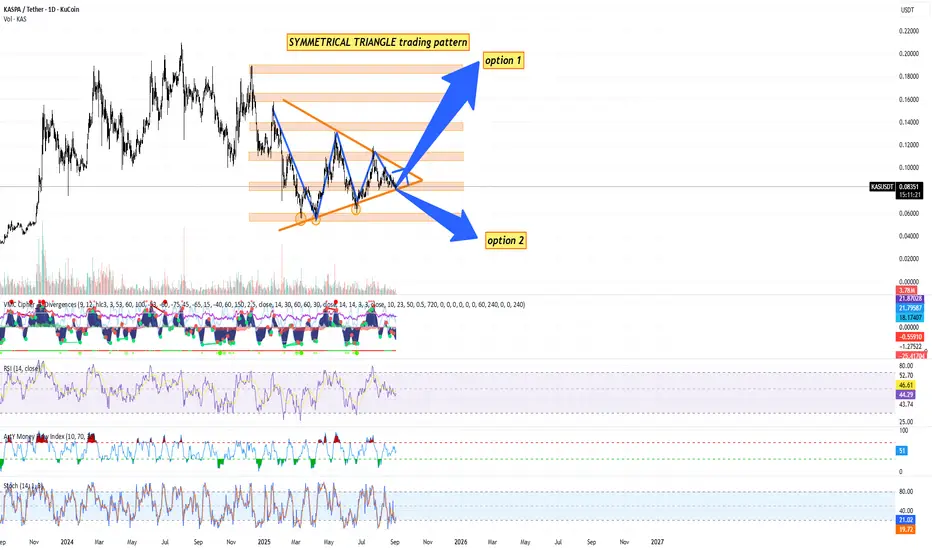
The price is consolidating within a Symmetrical Triangle pattern.
This is a neutral continuation pattern – it signals that a major breakout (either upward or downward) is approaching as the apex is nearing.
Both higher lows and lower highs confirm the formation.
Key Support & Resistance Levels
Immediate support zone: $0.080 – $0.082
Strong support below: $0.070
Immediate resistance: $0.095 – $0.100
Major resistances above: $0.120, $0.140, $0.160, $0.200, $0.220
Indicators
Volume: Declining within the triangle – typical before a breakout.
RSI (14): ~46 → Neutral, no overbought/oversold signals.
Stochastic RSI: Oversold (~20), suggesting possible short-term upside bounce.
MFI (Money Flow Index): Neutral (~51), showing balanced inflows/outflows.
MACD/VM indicator: Bearish momentum has slowed, histogram flattening.
Scenarios
Option 1 (Bullish breakout): If KAS breaks above the $0.095–$0.100 zone with volume, next targets are $0.120 → $0.140 → $0.160 → $0.200+.
Option 2 (Bearish breakdown): If KAS loses $0.080, potential retest of $0.070 → $0.060 support levels.
Trading Plan for KAS/USDT
🔹 Short-Term Swing Trade (1–4 weeks)
Entry Zone (Buy):
Aggressive: $0.082 – $0.085 (current support area).
Conservative: On confirmed breakout above $0.095 with volume.
Stop Loss:
Below $0.078 (tight stop) OR below $0.070 (safe stop).
Take Profit Targets:
$0.100 (first resistance, partial TP)
$0.120 (main target)
$0.140 (strong resistance)
🔹 Medium-Term Position Trade (1–3 months)
Entry Strategy: Accumulate in the $0.080–$0.085 range.
Stop Loss: Below $0.070 (close daily candle confirmation).
Targets:
Base case: $0.160
Optimistic case: $0.200 – $0.220
🔹 Risk Management
Risk per trade: 1–2% of portfolio.
Position sizing according to stop-loss distance.
Avoid over-leveraging; triangle breakouts can produce false moves before direction confirms.
Kaspa is entering the decision zone – the symmetrical triangle is compressing, and a major breakout is imminent in coming weeks.
Momentum indicators show neutrality, giving equal probability for either breakout direction.
The safest approach is to wait for breakout confirmation (daily close above $0.095 or below $0.080 with volume).
If bullish, Kaspa could target +40–100% upside over the next quarter. If bearish, downside risk is -20–30%.
Recommendation:
For conservative traders → wait for breakout confirmation.
For aggressive traders → accumulate around support ($0.082–$0.085) with tight stop-loss below $0.078 and scale out profits at resistance levels.
Chart Pattern
The price is consolidating within a Symmetrical Triangle pattern.
This is a neutral continuation pattern – it signals that a major breakout (either upward or downward) is approaching as the apex is nearing.
Both higher lows and lower highs confirm the formation.
Key Support & Resistance Levels
Immediate support zone: $0.080 – $0.082
Strong support below: $0.070
Immediate resistance: $0.095 – $0.100
Major resistances above: $0.120, $0.140, $0.160, $0.200, $0.220
Indicators
Volume: Declining within the triangle – typical before a breakout.
RSI (14): ~46 → Neutral, no overbought/oversold signals.
Stochastic RSI: Oversold (~20), suggesting possible short-term upside bounce.
MFI (Money Flow Index): Neutral (~51), showing balanced inflows/outflows.
MACD/VM indicator: Bearish momentum has slowed, histogram flattening.
Scenarios
Option 1 (Bullish breakout): If KAS breaks above the $0.095–$0.100 zone with volume, next targets are $0.120 → $0.140 → $0.160 → $0.200+.
Option 2 (Bearish breakdown): If KAS loses $0.080, potential retest of $0.070 → $0.060 support levels.
Trading Plan for KAS/USDT
🔹 Short-Term Swing Trade (1–4 weeks)
Entry Zone (Buy):
Aggressive: $0.082 – $0.085 (current support area).
Conservative: On confirmed breakout above $0.095 with volume.
Stop Loss:
Below $0.078 (tight stop) OR below $0.070 (safe stop).
Take Profit Targets:
$0.100 (first resistance, partial TP)
$0.120 (main target)
$0.140 (strong resistance)
🔹 Medium-Term Position Trade (1–3 months)
Entry Strategy: Accumulate in the $0.080–$0.085 range.
Stop Loss: Below $0.070 (close daily candle confirmation).
Targets:
Base case: $0.160
Optimistic case: $0.200 – $0.220
🔹 Risk Management
Risk per trade: 1–2% of portfolio.
Position sizing according to stop-loss distance.
Avoid over-leveraging; triangle breakouts can produce false moves before direction confirms.
Kaspa is entering the decision zone – the symmetrical triangle is compressing, and a major breakout is imminent in coming weeks.
Momentum indicators show neutrality, giving equal probability for either breakout direction.
The safest approach is to wait for breakout confirmation (daily close above $0.095 or below $0.080 with volume).
If bullish, Kaspa could target +40–100% upside over the next quarter. If bearish, downside risk is -20–30%.
Recommendation:
For conservative traders → wait for breakout confirmation.
For aggressive traders → accumulate around support ($0.082–$0.085) with tight stop-loss below $0.078 and scale out profits at resistance levels.
면책사항
해당 정보와 게시물은 금융, 투자, 트레이딩 또는 기타 유형의 조언이나 권장 사항으로 간주되지 않으며, 트레이딩뷰에서 제공하거나 보증하는 것이 아닙니다. 자세한 내용은 이용 약관을 참조하세요.
면책사항
해당 정보와 게시물은 금융, 투자, 트레이딩 또는 기타 유형의 조언이나 권장 사항으로 간주되지 않으며, 트레이딩뷰에서 제공하거나 보증하는 것이 아닙니다. 자세한 내용은 이용 약관을 참조하세요.