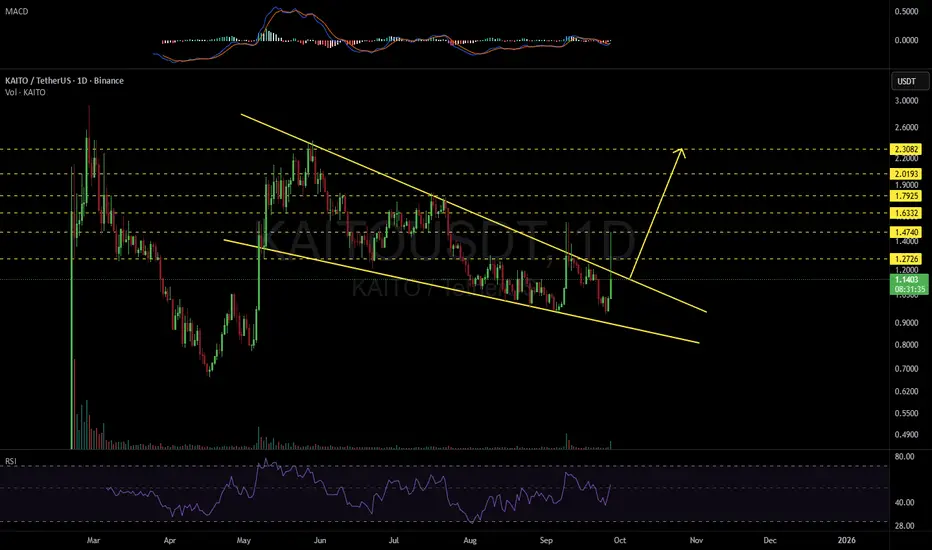
#KAITO is moving inside a falling wedge pattern on the daily chart. Volume has increased and RSI and MACD are turning bullish. #KAITO is on the verge of breaking out. If that happens, the potential targets are:
🎯 $1.2726
🎯 $1.4740
🎯 $1.6332
🎯 $1.7925
🎯 $2.0193
🎯 $2.3082
⚠️ Always remember to use a tight stop-loss and follow proper risk management.
🎯 $1.2726
🎯 $1.4740
🎯 $1.6332
🎯 $1.7925
🎯 $2.0193
🎯 $2.3082
⚠️ Always remember to use a tight stop-loss and follow proper risk management.
면책사항
이 정보와 게시물은 TradingView에서 제공하거나 보증하는 금융, 투자, 거래 또는 기타 유형의 조언이나 권고 사항을 의미하거나 구성하지 않습니다. 자세한 내용은 이용 약관을 참고하세요.
면책사항
이 정보와 게시물은 TradingView에서 제공하거나 보증하는 금융, 투자, 거래 또는 기타 유형의 조언이나 권고 사항을 의미하거나 구성하지 않습니다. 자세한 내용은 이용 약관을 참고하세요.