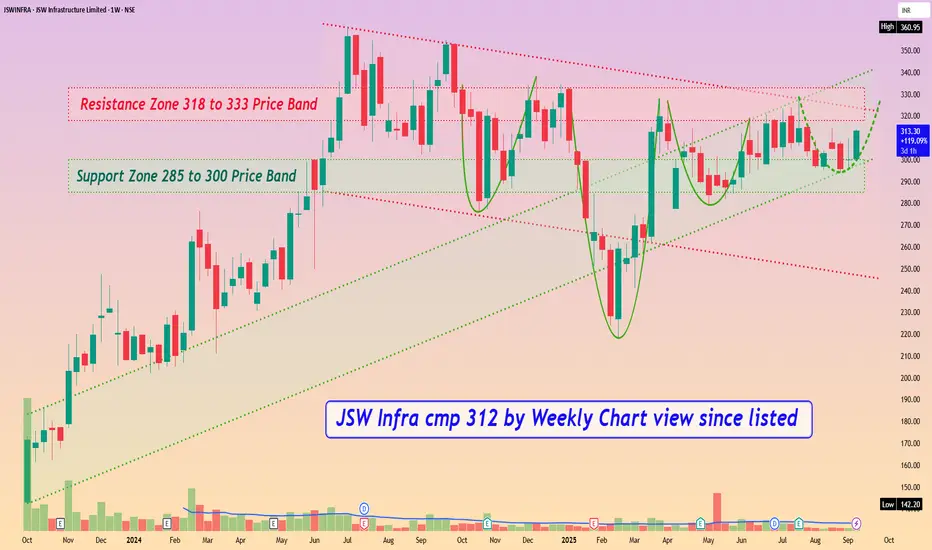
JSW Infra cmp 312 by Weekly Chart view since listed
- Support Zone 285 to 300 Price Band
- Resistance Zone 318 to 333 Price Band
- Bullish Rounding Bottoms repeated under the Resistance Zone neckline
- Stock making Higher High Lower High pattern within up-trending price channel momentum
- Stock traversing within Rising Support + Price Channel and attempting Falling Resistance + Price Channel Breakout
면책사항
해당 정보와 게시물은 금융, 투자, 트레이딩 또는 기타 유형의 조언이나 권장 사항으로 간주되지 않으며, 트레이딩뷰에서 제공하거나 보증하는 것이 아닙니다. 자세한 내용은 이용 약관을 참조하세요.
면책사항
해당 정보와 게시물은 금융, 투자, 트레이딩 또는 기타 유형의 조언이나 권장 사항으로 간주되지 않으며, 트레이딩뷰에서 제공하거나 보증하는 것이 아닙니다. 자세한 내용은 이용 약관을 참조하세요.