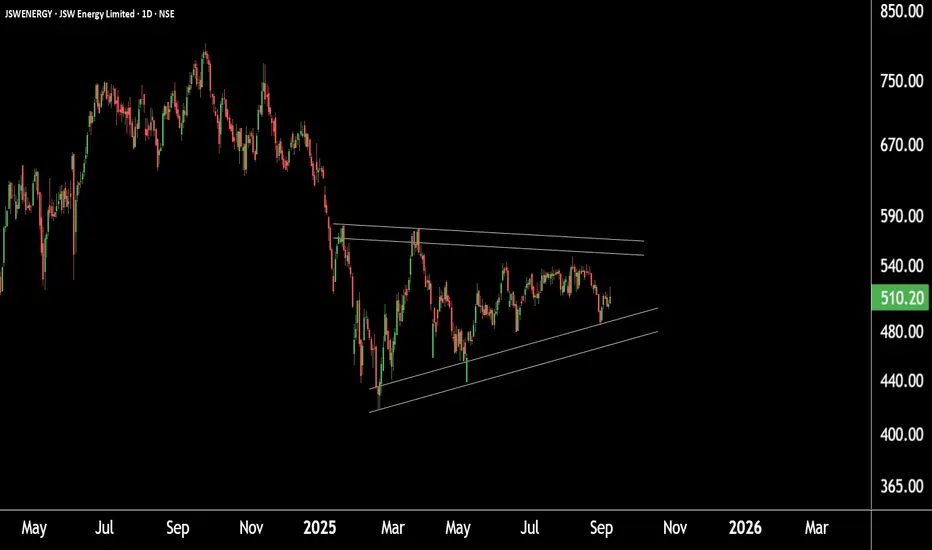
This is the daily timeframe chart of JSW Energy.
The stock is currently forming a symmetrical triangle pattern with support around ₹465–₹475 and resistance near ₹564–₹570.
If JSW Energy sustains above this resistance zone, it could trigger a breakout, potentially leading to higher price levels in the coming sessions.
Thank you.
The stock is currently forming a symmetrical triangle pattern with support around ₹465–₹475 and resistance near ₹564–₹570.
If JSW Energy sustains above this resistance zone, it could trigger a breakout, potentially leading to higher price levels in the coming sessions.
Thank you.
@RahulSaraoge
Connect us at t.me/stridesadvisory
Connect us at t.me/stridesadvisory
면책사항
이 정보와 게시물은 TradingView에서 제공하거나 보증하는 금융, 투자, 거래 또는 기타 유형의 조언이나 권고 사항을 의미하거나 구성하지 않습니다. 자세한 내용은 이용 약관을 참고하세요.
@RahulSaraoge
Connect us at t.me/stridesadvisory
Connect us at t.me/stridesadvisory
면책사항
이 정보와 게시물은 TradingView에서 제공하거나 보증하는 금융, 투자, 거래 또는 기타 유형의 조언이나 권고 사항을 의미하거나 구성하지 않습니다. 자세한 내용은 이용 약관을 참고하세요.