Description:
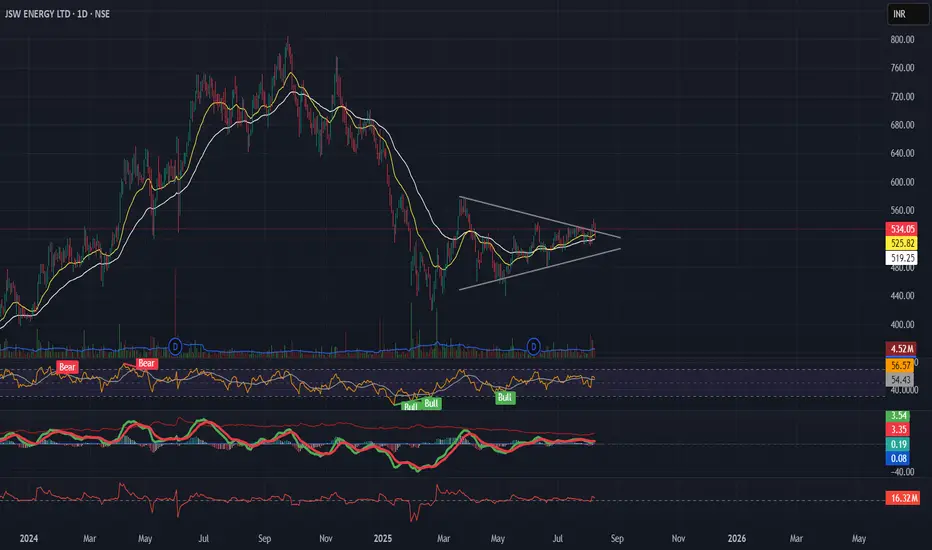
JSW Energy is forming a symmetrical triangle on the daily chart after a downtrend — resembling a potential bearish pennant, but price structure, sloping EMAs, rising momentum, and positive EFI hint at bullish strength.
📌 Breakout Level: ₹534
📉 Stoploss: ₹519 (ATR-based)
🎯 Targets: ₹563 → ₹597 → ₹694 (as per Fib projections)
🧭 Macro Context:
- Infra & Energy sectors improving
- Govt push for renewables
- Dollar weakening, risk-on tone aiding sentiment
Structure, volume, and macro are aligned — tracking this breakout closely.
면책사항
해당 정보와 게시물은 금융, 투자, 트레이딩 또는 기타 유형의 조언이나 권장 사항으로 간주되지 않으며, 트레이딩뷰에서 제공하거나 보증하는 것이 아닙니다. 자세한 내용은 이용 약관을 참조하세요.
면책사항
해당 정보와 게시물은 금융, 투자, 트레이딩 또는 기타 유형의 조언이나 권장 사항으로 간주되지 않으며, 트레이딩뷰에서 제공하거나 보증하는 것이 아닙니다. 자세한 내용은 이용 약관을 참조하세요.