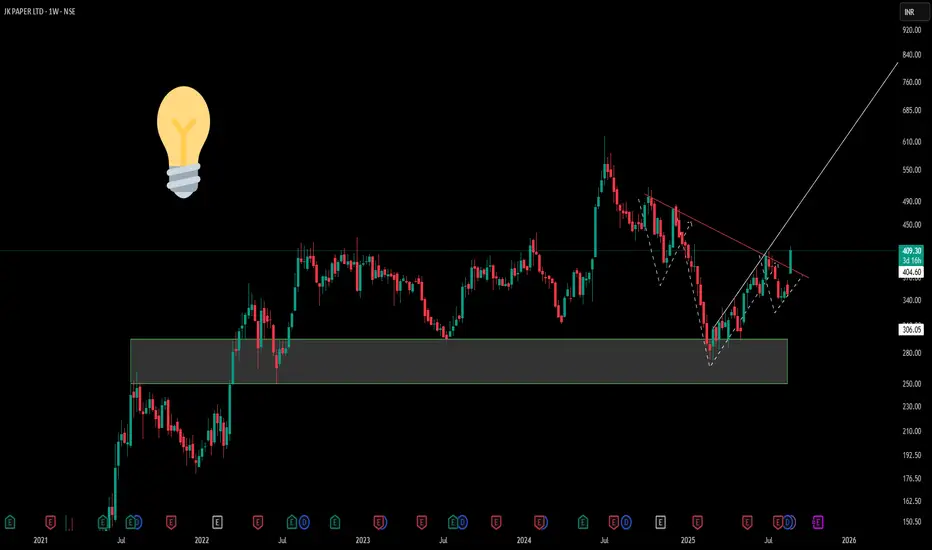
1) Supply-Demand Conversion Zone Observation
The highlighted grey rectangular zone on the chart represents a critical supply-demand conversion area. This zone, spanning approximately the ₹280-₹320 range, has historically acted as a significant inflection point where institutional money flow patterns have shifted.
2) The Inverted Head and Shoulders Formation
Above this conversion zone sits a textbook inverted head and shoulders pattern, meticulously marked with dotted lines. This formation showcases three distinct troughs:
-Left Shoulder: Formed during the initial decline phase
-Head: The deepest trough representing maximum bearish sentiment
-Right Shoulder: A higher low indicating weakening selling pressure
3) The pattern's neckline resistance (depicted by the red counter-trend line) : Its true nature is to provide resistance as a downward sloping trend continues up until trend shifts, also know as Market structure shift .
Disclaimer: This analysis is purely educational and structural in nature. It does not constitute investment advice, trading recommendations, or buy/sell signals. Always conduct your own research and consult with qualified financial advisors before making investment decisions.
🎯 Master My Self-Made Trading Strategy
📈 Telegram (Learn Today): t.me/hashtaghammer
✅ WhatsApp (Learn Today): wa.me/919455664601
📈 Telegram (Learn Today): t.me/hashtaghammer
✅ WhatsApp (Learn Today): wa.me/919455664601
관련 발행물
면책사항
이 정보와 게시물은 TradingView에서 제공하거나 보증하는 금융, 투자, 거래 또는 기타 유형의 조언이나 권고 사항을 의미하거나 구성하지 않습니다. 자세한 내용은 이용 약관을 참고하세요.