📈 Intraday Support & Resistance Levels
Resistance Levels:
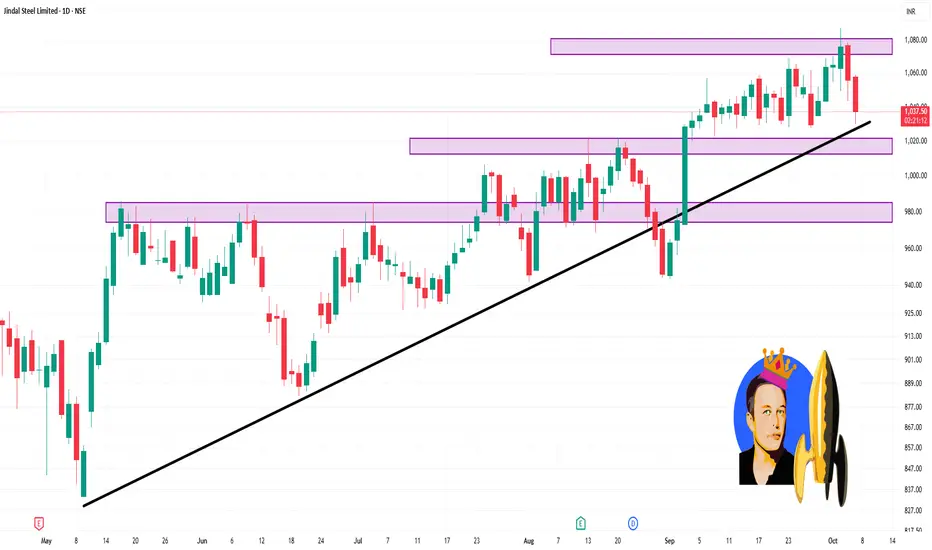
₹1,078.87
₹1,071.93
₹1,063.47
Support Levels:
₹1,056.54
₹1,048.07
₹1,041.13
These levels are derived from pivot point calculations and are useful for short-term trading decisions.
🔍 Technical Indicators
Relative Strength Index (RSI): Currently at 39.78, indicating a bearish condition.
MACD: At -3.67, suggesting a bearish trend.
Moving Averages: The stock shows a strong sell outlook based on moving averages ranging from MA5 to MA200, with 2 buy signals and 10 sell signals.
Resistance Levels:
₹1,078.87
₹1,071.93
₹1,063.47
Support Levels:
₹1,056.54
₹1,048.07
₹1,041.13
These levels are derived from pivot point calculations and are useful for short-term trading decisions.
🔍 Technical Indicators
Relative Strength Index (RSI): Currently at 39.78, indicating a bearish condition.
MACD: At -3.67, suggesting a bearish trend.
Moving Averages: The stock shows a strong sell outlook based on moving averages ranging from MA5 to MA200, with 2 buy signals and 10 sell signals.
관련 발행물
면책사항
이 정보와 게시물은 TradingView에서 제공하거나 보증하는 금융, 투자, 거래 또는 기타 유형의 조언이나 권고 사항을 의미하거나 구성하지 않습니다. 자세한 내용은 이용 약관을 참고하세요.
관련 발행물
면책사항
이 정보와 게시물은 TradingView에서 제공하거나 보증하는 금융, 투자, 거래 또는 기타 유형의 조언이나 권고 사항을 의미하거나 구성하지 않습니다. 자세한 내용은 이용 약관을 참고하세요.