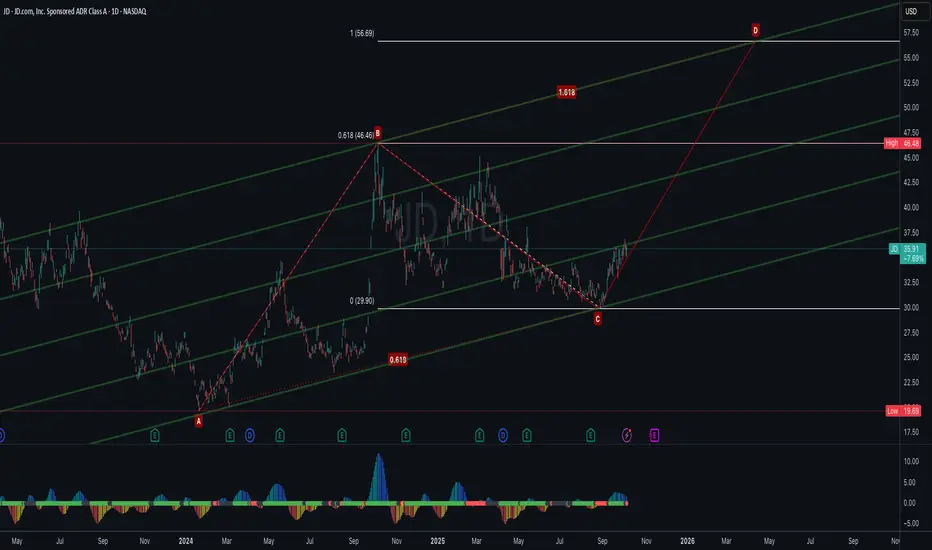
JD.com (JD) is forming a bullish ABCD harmonic pattern, with the current price advancing from point C toward the projected D completion zone. Based on the Fibonacci measurements, the AB=CD projection and 1.618 extension align near $56–57, suggesting a strong potential target area and confluence with the upper channel resistance.
A sustained move above $46.5 (B point) would confirm the continuation toward the D leg target. Momentum indicators are gradually turning positive, supporting the bullish bias in this setup.
Invalidation:
If price reverses and breaks below the C point, the ABCD harmonic structure would be invalidated, signaling potential weakness or a deeper retracement.
면책사항
해당 정보와 게시물은 금융, 투자, 트레이딩 또는 기타 유형의 조언이나 권장 사항으로 간주되지 않으며, 트레이딩뷰에서 제공하거나 보증하는 것이 아닙니다. 자세한 내용은 이용 약관을 참조하세요.
면책사항
해당 정보와 게시물은 금융, 투자, 트레이딩 또는 기타 유형의 조언이나 권장 사항으로 간주되지 않으며, 트레이딩뷰에서 제공하거나 보증하는 것이 아닙니다. 자세한 내용은 이용 약관을 참조하세요.