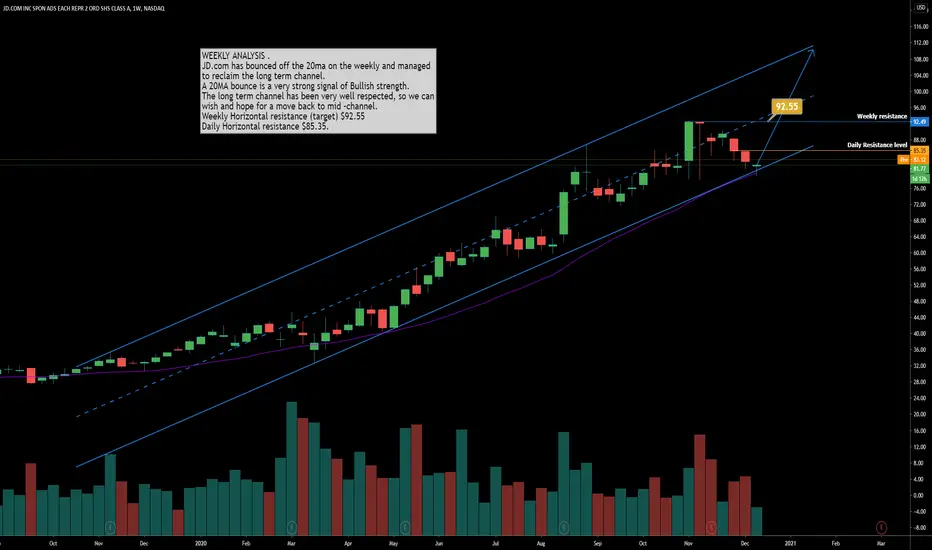
JD.com has bounced off the 20ma on the weekly and managed
to reclaim the long term channel.
A 20MA bounce is a very strong signal of Bullish strength.
The long term channel has been very well respected, so we can
wish and hope for a move back to mid -channel.
Weekly Horizontal resistance (target) $92.55
Daily Horizontal resistance $85.35.
노트
노트
Daily chart shows a safer entry above MA's면책사항
해당 정보와 게시물은 금융, 투자, 트레이딩 또는 기타 유형의 조언이나 권장 사항으로 간주되지 않으며, 트레이딩뷰에서 제공하거나 보증하는 것이 아닙니다. 자세한 내용은 이용 약관을 참조하세요.
면책사항
해당 정보와 게시물은 금융, 투자, 트레이딩 또는 기타 유형의 조언이나 권장 사항으로 간주되지 않으며, 트레이딩뷰에서 제공하거나 보증하는 것이 아닙니다. 자세한 내용은 이용 약관을 참조하세요.