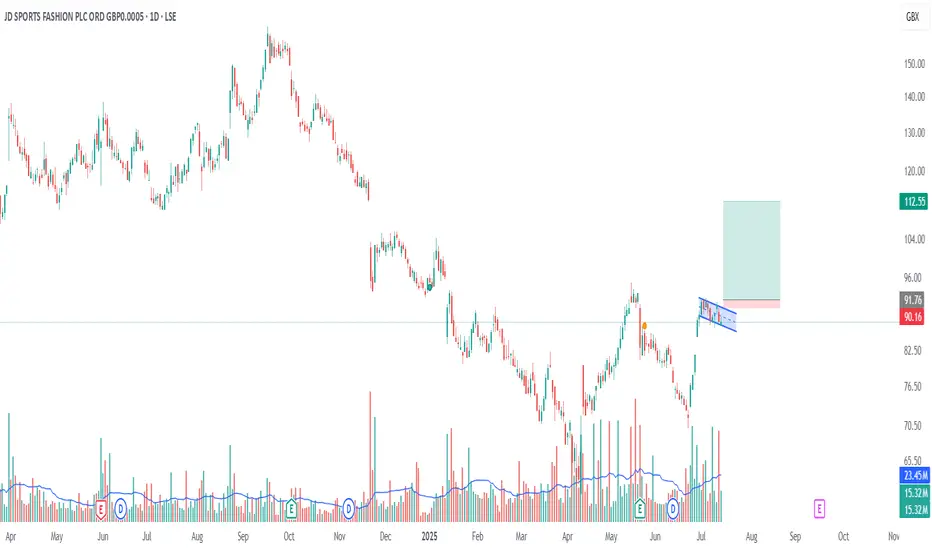
A bull flag pattern is forming on the 1-day chart, supported by a steady increase in volume—suggesting growing bullish momentum.
Flagpole base: ~72
Potential breakout level: ~92
First price target (PT1): ~100 (next key resistance level)
Measured move target (PT2): ~112 (based on flagpole height)
This setup indicates a strong potential for continuation if price breaks above the 92 level with volume confirmation.
Flagpole base: ~72
Potential breakout level: ~92
First price target (PT1): ~100 (next key resistance level)
Measured move target (PT2): ~112 (based on flagpole height)
This setup indicates a strong potential for continuation if price breaks above the 92 level with volume confirmation.
면책사항
이 정보와 게시물은 TradingView에서 제공하거나 보증하는 금융, 투자, 거래 또는 기타 유형의 조언이나 권고 사항을 의미하거나 구성하지 않습니다. 자세한 내용은 이용 약관을 참고하세요.
면책사항
이 정보와 게시물은 TradingView에서 제공하거나 보증하는 금융, 투자, 거래 또는 기타 유형의 조언이나 권고 사항을 의미하거나 구성하지 않습니다. 자세한 내용은 이용 약관을 참고하세요.