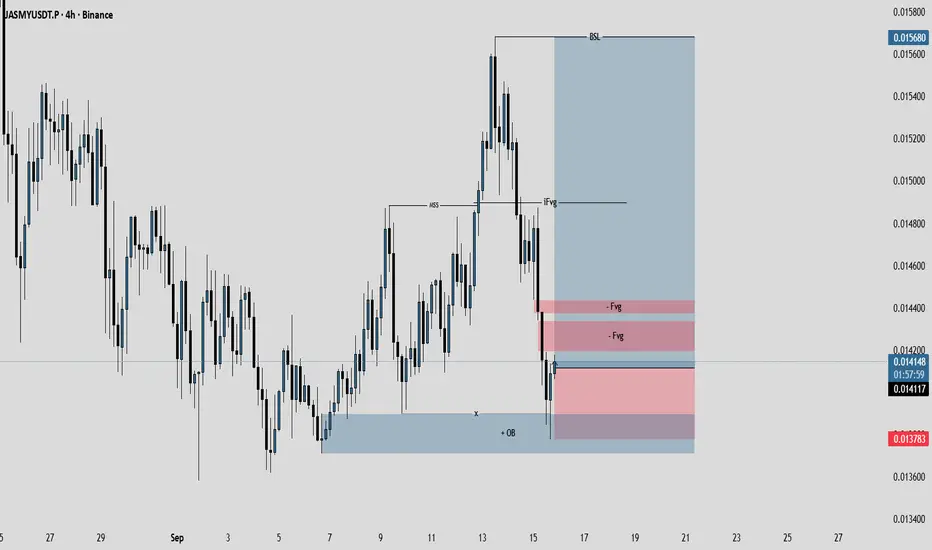
JASMYUSDT.P shows a short-term bearish correction within a broader neutral-to-bullish structure. The price has declined from a local high near $0.017 in late August to recent lows around $0.014, forming a descending channel with lower highs and lows. Volume appears moderate during the pullback, suggesting accumulation rather than panic selling, but spikes on downside wicks indicate liquidity grabs at key supports,
Hold above $0.0140; RSI >50; volume spike on green candles. Break $0.0155 confirms.
JASMY's 4H setup favors a long (bullish) bias if support holds, given accumulation signals and altseason tailwinds. However, a break below $0.0136 could trigger shorts. Below is a table of scenarios, probabilities (based on technicals and sentiment), and exact trade points (risk-reward ~1:2; use 1–2%
액티브 트레이드
Updated JASMYUSDT.P Analysis (4H) - 11:40 AM +03, Sep 18, 2025Since the last update, JASMYUSDT.P successfully hit the first take-profit (TP1) at the initial Imbalance Fair Value Gap (IFVG) around $0.0155, confirming the anticipated bounce from the key support cluster at $0.0140. This move validated the accumulation narrative, as price swept liquidity lows near $0.01399 (testing the Order Block/OB zone) before reversing with a clear Market Structure Shift (MSS) higher. The short-term bearish correction within the broader neutral-to-bullish channel has resolved bullishly, with moderate volume on the upside candles supporting sustained momentum. Current price sits at ~$0.01479 (up 4% in 24h), consolidating just below the recent 7d high of $0.01561. RSI (14) on 4H is neutral at ~46-51 (recovering from oversold ~37 earlier this week), flashing early bullish divergence, while MACD shows a weakening bearish histogram—signaling potential for continuation if volume spikes on greens.
면책사항
이 정보와 게시물은 TradingView에서 제공하거나 보증하는 금융, 투자, 거래 또는 기타 유형의 조언이나 권고 사항을 의미하거나 구성하지 않습니다. 자세한 내용은 이용 약관을 참고하세요.
면책사항
이 정보와 게시물은 TradingView에서 제공하거나 보증하는 금융, 투자, 거래 또는 기타 유형의 조언이나 권고 사항을 의미하거나 구성하지 않습니다. 자세한 내용은 이용 약관을 참고하세요.