🔵 Stock: JAI BALAJI (Weekly)
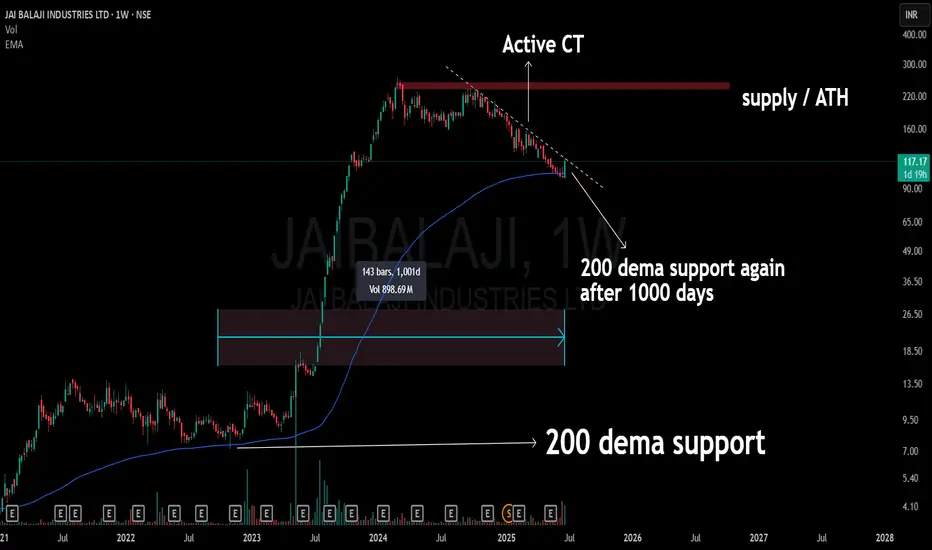
🔥 Support Revisit: Back to the 200 DEMA after 1000 days
A level that once acted as the launchpad.
Current structure shows an active compression trend (CT) right into this long-term dynamic support.
The chart also aligns below a major supply zone / ATH band, keeping the broader context in check.
📉 No prediction. No call. Just structure, levels, and time-tested zones doing the talking.
🎯 Master My Self-Made Trading Strategy
📈 Telegram (Learn Today): t.me/hashtaghammer
✅ WhatsApp (Learn Today): wa.me/919455664601
📈 Telegram (Learn Today): t.me/hashtaghammer
✅ WhatsApp (Learn Today): wa.me/919455664601
관련 발행물
면책사항
해당 정보와 게시물은 금융, 투자, 트레이딩 또는 기타 유형의 조언이나 권장 사항으로 간주되지 않으며, 트레이딩뷰에서 제공하거나 보증하는 것이 아닙니다. 자세한 내용은 이용 약관을 참조하세요.