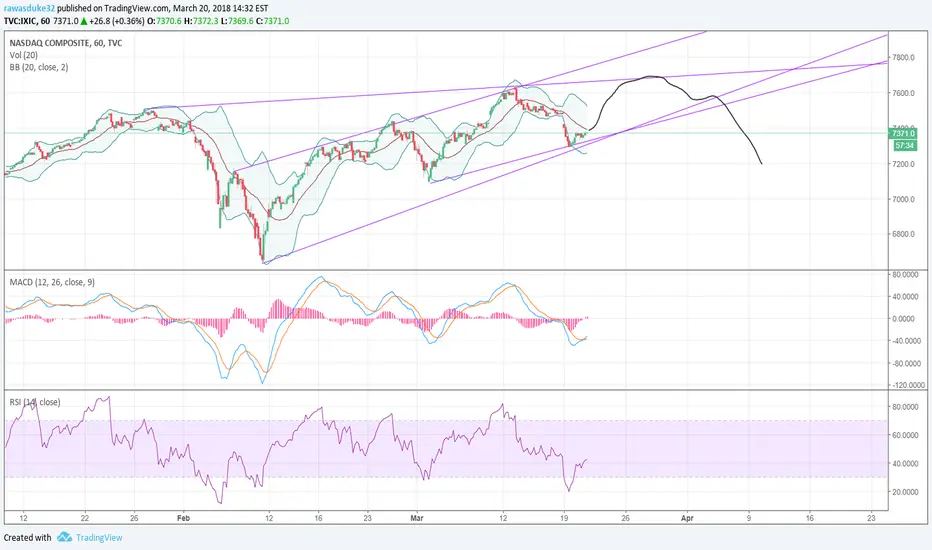
On the H1 the MACD and RSI are looking nice and bull. Chart just bounced of support and possibly headed up to resistance at 7680ish. The daily chart is showing the macd beginning to cross downwards, which could bring a correction in the near future. After the first week of April were getting close to the pinch point of the wedge. It could still break up, but we're also moving in a ascending channel, which typically breaks downwards.
면책사항
이 정보와 게시물은 TradingView에서 제공하거나 보증하는 금융, 투자, 거래 또는 기타 유형의 조언이나 권고 사항을 의미하거나 구성하지 않습니다. 자세한 내용은 이용 약관을 참고하세요.
면책사항
이 정보와 게시물은 TradingView에서 제공하거나 보증하는 금융, 투자, 거래 또는 기타 유형의 조언이나 권고 사항을 의미하거나 구성하지 않습니다. 자세한 내용은 이용 약관을 참고하세요.