📈 Recent 1-Week Performance
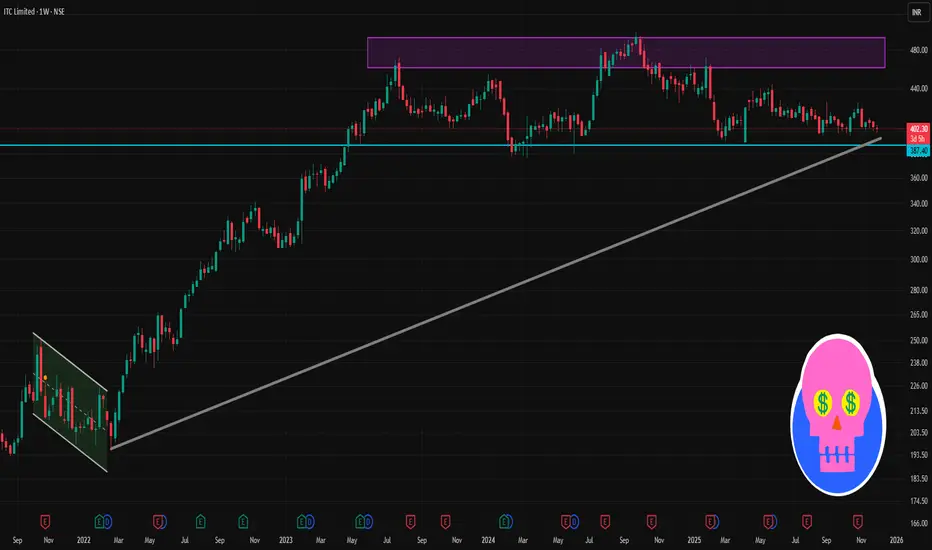
Around Dec 2 2025, ITC is trading ~ ₹403–404.
Over last 1 week, the stock has moved up roughly +0.5 % to +0.6 % according to available weekly return data.
The 7-day exponential moving average (EMA) is also near ~₹402 — which suggests price is close to short-term average, not showing sharp divergence yet.
✅ What Price Action Would Suggest
If price holds above ₹402–403 and breaks above ₹405–407, that could indicate short-term bullish bias.
If price falls below ₹400, watch for possible further drop — support zone is ~₹398; a sharp break could shift short-term sentiment negative.
If price consolidates between ~₹402 and ~₹407, expect range-bound behaviour until a clear breakout or breakdown.
관련 발행물
면책사항
해당 정보와 게시물은 금융, 투자, 트레이딩 또는 기타 유형의 조언이나 권장 사항으로 간주되지 않으며, 트레이딩뷰에서 제공하거나 보증하는 것이 아닙니다. 자세한 내용은 이용 약관을 참조하세요.
관련 발행물
면책사항
해당 정보와 게시물은 금융, 투자, 트레이딩 또는 기타 유형의 조언이나 권장 사항으로 간주되지 않으며, 트레이딩뷰에서 제공하거나 보증하는 것이 아닙니다. 자세한 내용은 이용 약관을 참조하세요.