The technical structure for this asset is exhibiting compelling signs that a significant low may be forming, suggesting the prolonged downtrend could be exhausting and a reversal phase may be underway. The convergence of key Fibonacci levels and emerging bullish signals creates a narrative worthy of close attention.
1. The Macro View: A Likely Bottom Formation
The assessment that the asset has "most likely bottomed" is based on key technical behaviors. This typically involves a period of price consolidation at lower levels, a slowing of downward momentum (as indicated by potential bullish divergences on oscillators like the RSI or MACD), and a clear rejection of further lows. This price action suggests that selling pressure is drying up and a new equilibrium is being established, providing a foundation for a potential new upward cycle.
2. The Fibonacci Framework: A Roadmap for the Reversal
Fibonacci retracement levels, applied to the most recent significant downtrend, provide a mathematical roadmap for identifying potential support, entry zones, and profit targets.
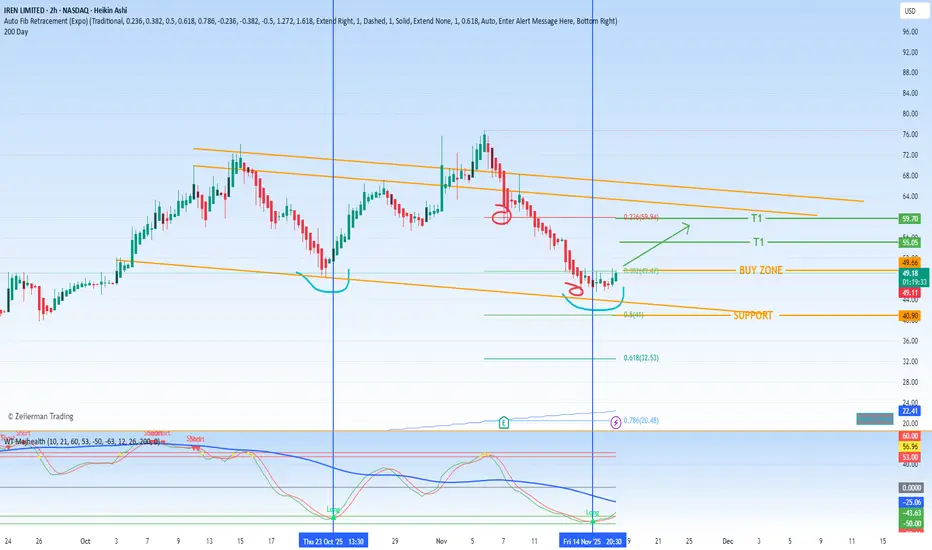
Primary Support (The 0.5 Fibonacci Level - $41): This level at $41 has acted as a critical foundation. The successful defense of this 0.50 retracement level is a strong technical sign. It represents a key psychological midpoint where buyers have historically stepped in with force, preventing further decline and solidifying this zone as the primary support floor for the new bullish thesis. A break below this level would seriously challenge the bottoming narrative.
Buy Zone (The 0.382 Fibonacci Level - $49.47): The $49.47 level is identified as a strategic accumulation zone. In a recovering market, prices often pull back to retest former resistance levels, which then turn into new support. A successful retest of the 0.382 level at $49.47, where the price touches this area and bounces, would offer a high-confidence entry point with a well-defined risk level just below the primary $41 support.
3. Profit-Taking Strategy and Emerging Signals
Take-Profit Targets: The initial recovery move has two clear technical objectives.
Initial Target: $55. This represents the first significant resistance zone where some profit-taking can be expected.
Extended Target: $59. A break above $55 opens the path to this more substantial target, which likely aligns with a previous swing high or a key Fibonacci extension level.
Potential Buy Signal (Blue Vertical Lines): Your observation of the "blue vertical lines" indicating a potential buy signal is crucial. This typically refers to a specific trigger from a momentum oscillator or a proprietary indicator. This signal adds a layer of confirmation, suggesting that not only is the price at a supportive level, but the underlying momentum is also shifting from bearish to bullish. This alignment between price (Fibonacci level) and momentum (buy signal) significantly strengthens the case for a sustainable upward move.
Synthesis and Strategic Outlook
The technical picture suggests the asset is in the early stages of a potential trend reversal.
The Bullish Narrative: The bottom appears to be in at the $41 (0.50 Fib) support. The strategy is to look for entry opportunities, ideally on a pullback towards the $49.47 (0.382 Fib) buy zone, especially if it coincides with a confirmed buy signal from your indicator (the blue vertical lines). The subsequent targets are $55 and $59.
Risk Management: The entire bullish thesis depends on the asset holding above the $41 support. A decisive break below this level would invalidate the bottoming premise and call for a re-evaluation.
In summary, patience is key. The setup is promising, but waiting for the price to interact with the defined buy zone and for confirming signals to align will provide a much higher-probability entry for the anticipated move toward the $55 and $59 targets.
1. The Macro View: A Likely Bottom Formation
The assessment that the asset has "most likely bottomed" is based on key technical behaviors. This typically involves a period of price consolidation at lower levels, a slowing of downward momentum (as indicated by potential bullish divergences on oscillators like the RSI or MACD), and a clear rejection of further lows. This price action suggests that selling pressure is drying up and a new equilibrium is being established, providing a foundation for a potential new upward cycle.
2. The Fibonacci Framework: A Roadmap for the Reversal
Fibonacci retracement levels, applied to the most recent significant downtrend, provide a mathematical roadmap for identifying potential support, entry zones, and profit targets.
Primary Support (The 0.5 Fibonacci Level - $41): This level at $41 has acted as a critical foundation. The successful defense of this 0.50 retracement level is a strong technical sign. It represents a key psychological midpoint where buyers have historically stepped in with force, preventing further decline and solidifying this zone as the primary support floor for the new bullish thesis. A break below this level would seriously challenge the bottoming narrative.
Buy Zone (The 0.382 Fibonacci Level - $49.47): The $49.47 level is identified as a strategic accumulation zone. In a recovering market, prices often pull back to retest former resistance levels, which then turn into new support. A successful retest of the 0.382 level at $49.47, where the price touches this area and bounces, would offer a high-confidence entry point with a well-defined risk level just below the primary $41 support.
3. Profit-Taking Strategy and Emerging Signals
Take-Profit Targets: The initial recovery move has two clear technical objectives.
Initial Target: $55. This represents the first significant resistance zone where some profit-taking can be expected.
Extended Target: $59. A break above $55 opens the path to this more substantial target, which likely aligns with a previous swing high or a key Fibonacci extension level.
Potential Buy Signal (Blue Vertical Lines): Your observation of the "blue vertical lines" indicating a potential buy signal is crucial. This typically refers to a specific trigger from a momentum oscillator or a proprietary indicator. This signal adds a layer of confirmation, suggesting that not only is the price at a supportive level, but the underlying momentum is also shifting from bearish to bullish. This alignment between price (Fibonacci level) and momentum (buy signal) significantly strengthens the case for a sustainable upward move.
Synthesis and Strategic Outlook
The technical picture suggests the asset is in the early stages of a potential trend reversal.
The Bullish Narrative: The bottom appears to be in at the $41 (0.50 Fib) support. The strategy is to look for entry opportunities, ideally on a pullback towards the $49.47 (0.382 Fib) buy zone, especially if it coincides with a confirmed buy signal from your indicator (the blue vertical lines). The subsequent targets are $55 and $59.
Risk Management: The entire bullish thesis depends on the asset holding above the $41 support. A decisive break below this level would invalidate the bottoming premise and call for a re-evaluation.
In summary, patience is key. The setup is promising, but waiting for the price to interact with the defined buy zone and for confirming signals to align will provide a much higher-probability entry for the anticipated move toward the $55 and $59 targets.
액티브 트레이드
A NICE BOUNCE FROM SUPPORT 면책사항
해당 정보와 게시물은 금융, 투자, 트레이딩 또는 기타 유형의 조언이나 권장 사항으로 간주되지 않으며, 트레이딩뷰에서 제공하거나 보증하는 것이 아닙니다. 자세한 내용은 이용 약관을 참조하세요.
면책사항
해당 정보와 게시물은 금융, 투자, 트레이딩 또는 기타 유형의 조언이나 권장 사항으로 간주되지 않으며, 트레이딩뷰에서 제공하거나 보증하는 것이 아닙니다. 자세한 내용은 이용 약관을 참조하세요.