📈 1-Week Performance Snapshot
Current Price: ₹153.20
1-Week Change: Approximately +0.07%
1-Month Change: Approximately -1.92%
3-Month Change: Approximately -5.12%
1-Year Change: Approximately -30.65%
📊 Recent Trading Activity
October 20, 2025: Opened at ₹151.54, reached a high of ₹154.98, and closed at ₹153.42.
October 17, 2025: Opened at ₹153.00, reached a high of ₹153.38, and closed at ₹151.05.
October 15, 2025: Closed at ₹153.29 after reporting a net profit of ₹549.33 crore for Q2 FY26.
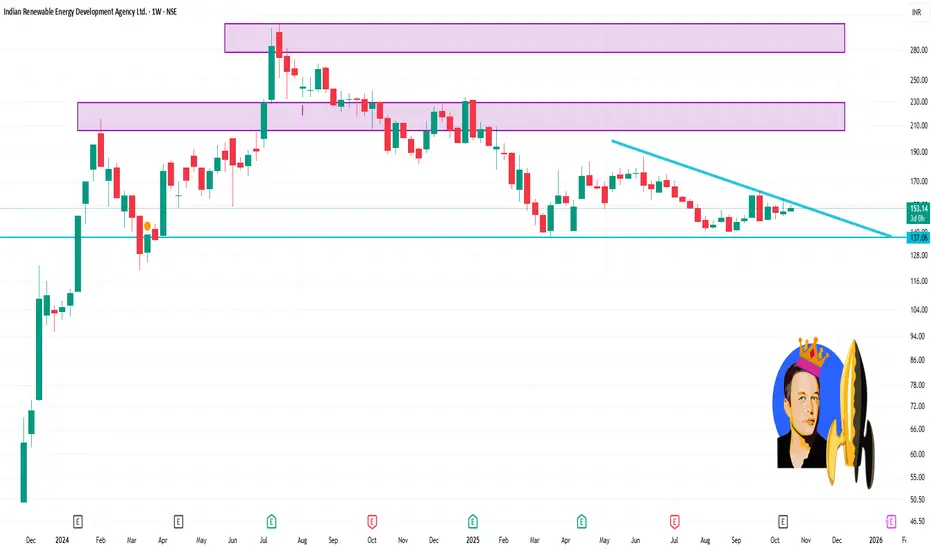
🔍 Technical Indicators
52-Week Range: ₹137.01 – ₹234.29
Market Capitalization: Approximately ₹43,079.56 crore
P/E Ratio: Approximately 23.49
Debt-to-Equity Ratio: Approximately 5.41
Dividend Yield: 0.00%
Current Price: ₹153.20
1-Week Change: Approximately +0.07%
1-Month Change: Approximately -1.92%
3-Month Change: Approximately -5.12%
1-Year Change: Approximately -30.65%
📊 Recent Trading Activity
October 20, 2025: Opened at ₹151.54, reached a high of ₹154.98, and closed at ₹153.42.
October 17, 2025: Opened at ₹153.00, reached a high of ₹153.38, and closed at ₹151.05.
October 15, 2025: Closed at ₹153.29 after reporting a net profit of ₹549.33 crore for Q2 FY26.
🔍 Technical Indicators
52-Week Range: ₹137.01 – ₹234.29
Market Capitalization: Approximately ₹43,079.56 crore
P/E Ratio: Approximately 23.49
Debt-to-Equity Ratio: Approximately 5.41
Dividend Yield: 0.00%
관련 발행물
면책사항
해당 정보와 게시물은 금융, 투자, 트레이딩 또는 기타 유형의 조언이나 권장 사항으로 간주되지 않으며, 트레이딩뷰에서 제공하거나 보증하는 것이 아닙니다. 자세한 내용은 이용 약관을 참조하세요.
관련 발행물
면책사항
해당 정보와 게시물은 금융, 투자, 트레이딩 또는 기타 유형의 조언이나 권장 사항으로 간주되지 않으며, 트레이딩뷰에서 제공하거나 보증하는 것이 아닙니다. 자세한 내용은 이용 약관을 참조하세요.