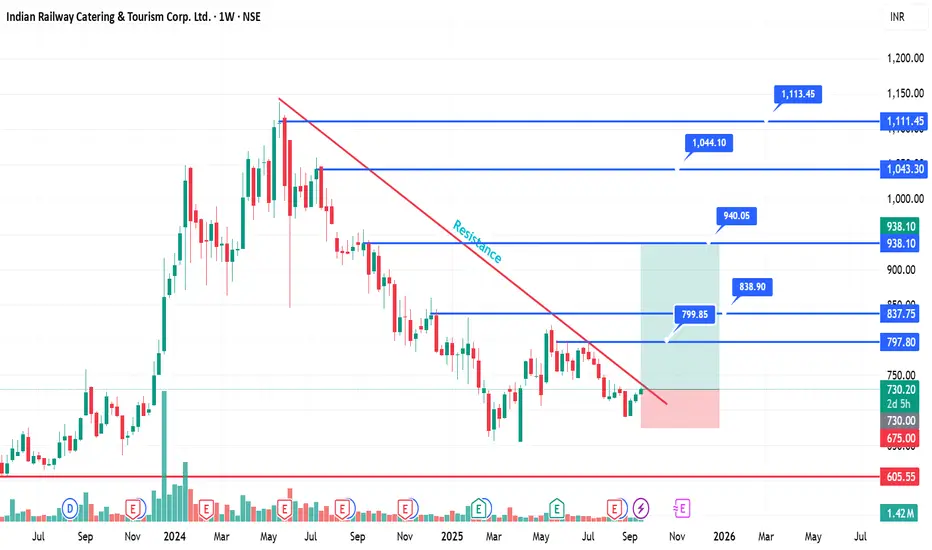
IRCTC has been in a prolonged downtrend but is now showing signs of a possible reversal after testing key support zones. The price is attempting to break the falling resistance trendline, which could trigger a bullish momentum if sustained.
🔑 Key Levels to Watch:
Support Zone: ₹675 – ₹605
Immediate Resistance Breakout Level: ₹730
Upside Targets:
₹797.80
₹837.75
₹938.10
₹1,043.30
₹1,111.45
📈 View:
If IRCTC manages to hold above ₹730 and breaks the resistance line with volume, we may see a strong rally towards ₹800+ and higher targets in the coming weeks.
📉 Risk:
A close below ₹675 may invalidate the setup and drag the stock towards ₹605 support.
⚠️ Disclaimer: This is only for educational and chart analysis purposes, not financial advice. Do your own research before investing/trading.
#IRCTC #StockMarketIndia #NSE #SwingTrading #Breakout #TradingSetup #StockAnalysis #ChartPattern #Resistance #Support #IndianStocks #WeeklyChart
면책사항
해당 정보와 게시물은 금융, 투자, 트레이딩 또는 기타 유형의 조언이나 권장 사항으로 간주되지 않으며, 트레이딩뷰에서 제공하거나 보증하는 것이 아닙니다. 자세한 내용은 이용 약관을 참조하세요.
면책사항
해당 정보와 게시물은 금융, 투자, 트레이딩 또는 기타 유형의 조언이나 권장 사항으로 간주되지 않으며, 트레이딩뷰에서 제공하거나 보증하는 것이 아닙니다. 자세한 내용은 이용 약관을 참조하세요.