📈 IPCA Laboratories – Weekly Technical Analysis (For Study Purpose Only)
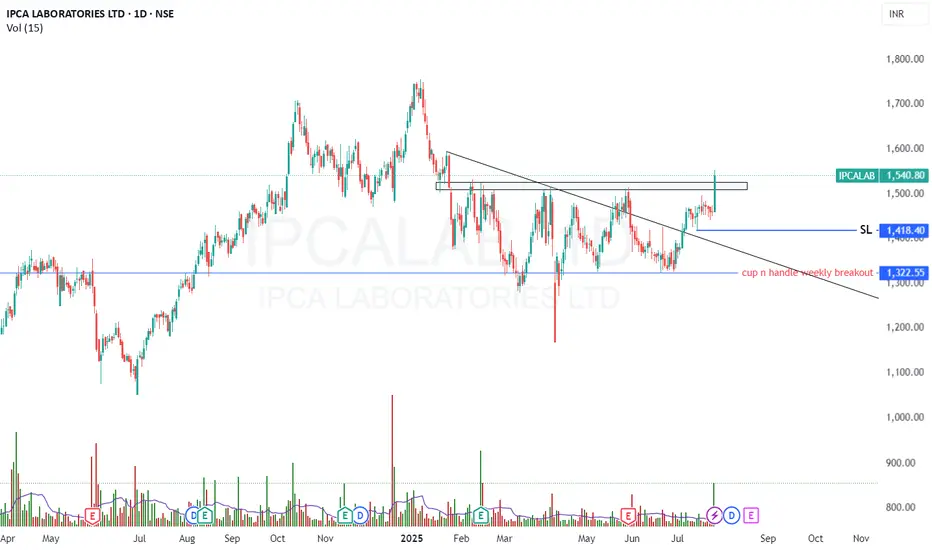
Ipca Labs has successfully completed a Cup and Handle breakout on the weekly chart, indicating a strong bullish setup after a prolonged consolidation phase.
After forming a double top and undergoing a nearly 6-month consolidation, the stock recently broke out above the neckline and range of ₹1320–₹1510, followed by a textbook retest of the breakout zone, which further strengthens the breakout's validity.
🔍 Key Technical Highlights:
✅ Pattern Formed: Weekly Cup and Handle retest and 6 month range breakout
📉 Previous Structure: Double top ➜ breakdown ➜ 6-month range consolidation
🔼 Breakout & Retest Zone: ₹1320–₹1510
✅ Retest Completed: Confirmed on weekly chart with supportive volume and price stability
🎯 Upside Targets:
Short-term: ₹1600
Medium-term: ₹1700
Long-term: New All-Time High (above ₹1750+)
🛑 Risk Management:
Stop-Loss: ₹1480 or (below retest zone)
📊 Supporting Indicators:
RSI trending upward, currently above 60 (bullish zone)
MACD crossover confirms positive momentum
Volume confirms strength during breakout
📌 Disclaimer: This analysis is for educational and study purposes only. Not a buy/sell recommendation.
면책사항
해당 정보와 게시물은 금융, 투자, 트레이딩 또는 기타 유형의 조언이나 권장 사항으로 간주되지 않으며, 트레이딩뷰에서 제공하거나 보증하는 것이 아닙니다. 자세한 내용은 이용 약관을 참조하세요.
면책사항
해당 정보와 게시물은 금융, 투자, 트레이딩 또는 기타 유형의 조언이나 권장 사항으로 간주되지 않으며, 트레이딩뷰에서 제공하거나 보증하는 것이 아닙니다. 자세한 내용은 이용 약관을 참조하세요.