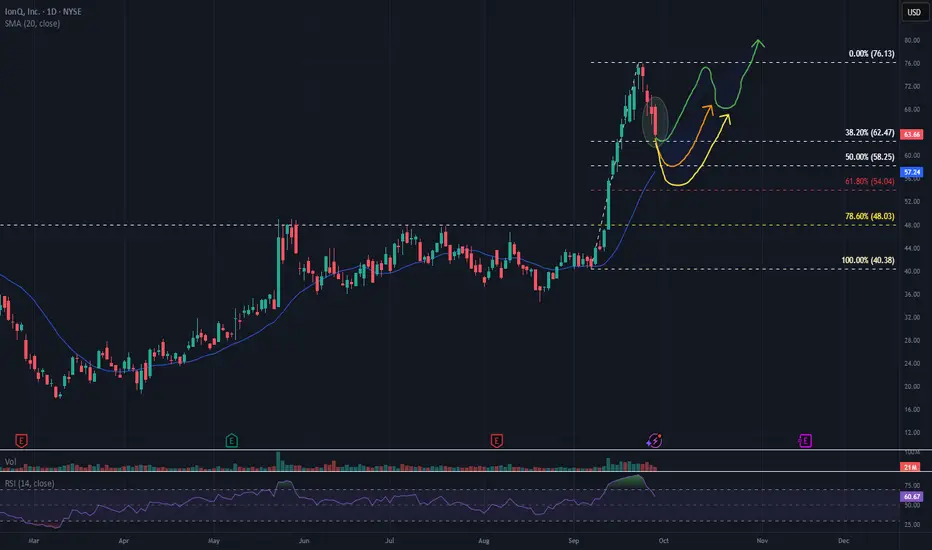
This chart of IonQ, Inc. (NYSE: IONQ) outlines a technical setup identifying three potential buy zones based on Fibonacci retracement levels and anticipated recovery paths:
First Buy Zone – 38.60% Retracement ~63$~~
This level may act as initial support. A bounce here could signal early recovery, especially if volume confirms buying interest.
Second Buy Zone – 50.00% Retracement ($58~~)
Highlighted by a yellow arrow, this zone suggests a short-term dip before a potential rebound. It aligns with a moderate correction and is often considered a strong technical level for accumulation.
Third Buy Zone – 61.80% (54$~~)
This deeper retracement zone is supported by a green arrow, indicating a longer-term recovery path. It may offer a high-reward entry point if the stock stabilizes and RSI confirms oversold conditions.
This analysis is for informational purposes only and does not constitute a recommendation to buy or sell any security. Always conduct your own research or consult a financial advisor before making investment decisions.
면책사항
이 정보와 게시물은 TradingView에서 제공하거나 보증하는 금융, 투자, 거래 또는 기타 유형의 조언이나 권고 사항을 의미하거나 구성하지 않습니다. 자세한 내용은 이용 약관을 참고하세요.
면책사항
이 정보와 게시물은 TradingView에서 제공하거나 보증하는 금융, 투자, 거래 또는 기타 유형의 조언이나 권고 사항을 의미하거나 구성하지 않습니다. 자세한 내용은 이용 약관을 참고하세요.