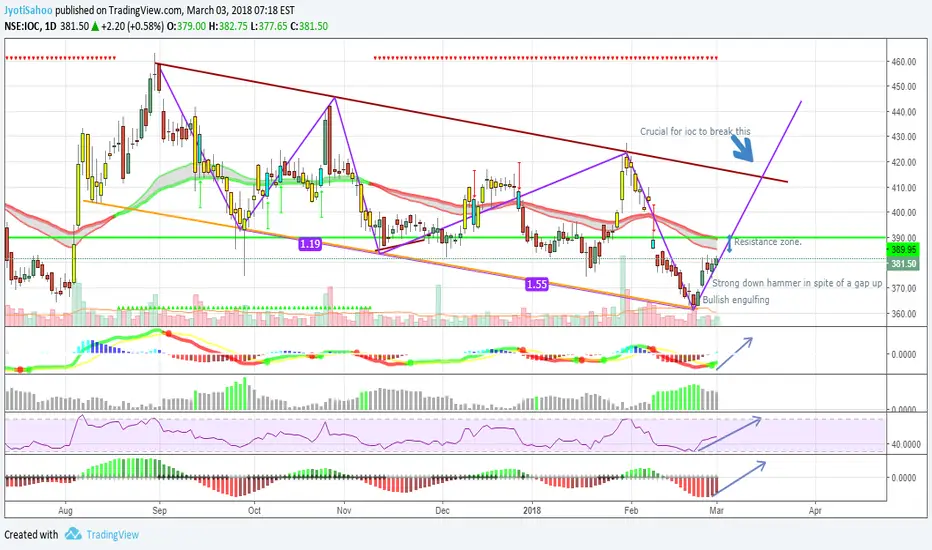
IOC on a daily chart is following a down channel .lower lows are being formed. and lower highs. this is a false recovery probably upto 414 . oscillators and tech indicators are in favor . this can be cashed in. the last 5 candles are pretty strong. but if we see a channel break out that will be a big bonus.
There is resistance zone around 390. if the stock sees to hold that level and volumes pick up . we can see upmove.
There is resistance zone around 390. if the stock sees to hold that level and volumes pick up . we can see upmove.
액티브 트레이드
노트
20 points profit. closing just above 400 was a very good sign.면책사항
해당 정보와 게시물은 금융, 투자, 트레이딩 또는 기타 유형의 조언이나 권장 사항으로 간주되지 않으며, 트레이딩뷰에서 제공하거나 보증하는 것이 아닙니다. 자세한 내용은 이용 약관을 참조하세요.
면책사항
해당 정보와 게시물은 금융, 투자, 트레이딩 또는 기타 유형의 조언이나 권장 사항으로 간주되지 않으며, 트레이딩뷰에서 제공하거나 보증하는 것이 아닙니다. 자세한 내용은 이용 약관을 참조하세요.