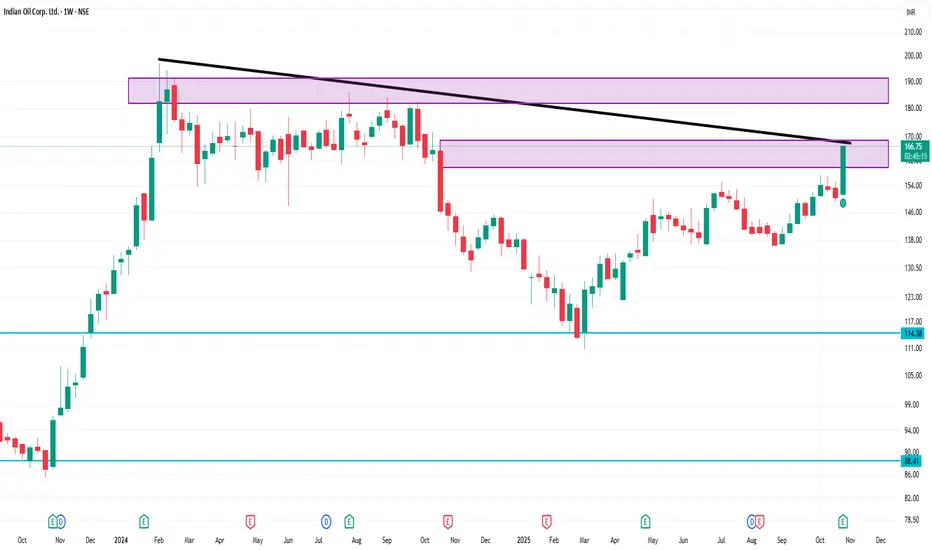
📍 Key Levels to Monitor (weekly chart)
Support zone: ~ ₹150-155. This is a region where past moving averages / consolidation occurred (also near 200-week MA).
Near-term support: ~ ₹160. If price dips, watch for reaction around this level.
Resistance / breakout area: ~ ₹166-170. Past highs / pivot region. If price convincingly breaks above this with volume, higher targets could be triggered. In the daily technicals, pivot-classic R1 ~ ₹166.54.
Next upside potential: If breakout happens, next zone maybe ~ ₹175-180 (psychological+historic highs) — but only once structure is confirmed.
Risk trigger: A close below ~ ₹150 might shift trend bias to more neutral/weak.
관련 발행물
면책사항
해당 정보와 게시물은 금융, 투자, 트레이딩 또는 기타 유형의 조언이나 권장 사항으로 간주되지 않으며, 트레이딩뷰에서 제공하거나 보증하는 것이 아닙니다. 자세한 내용은 이용 약관을 참조하세요.
관련 발행물
면책사항
해당 정보와 게시물은 금융, 투자, 트레이딩 또는 기타 유형의 조언이나 권장 사항으로 간주되지 않으며, 트레이딩뷰에서 제공하거나 보증하는 것이 아닙니다. 자세한 내용은 이용 약관을 참조하세요.