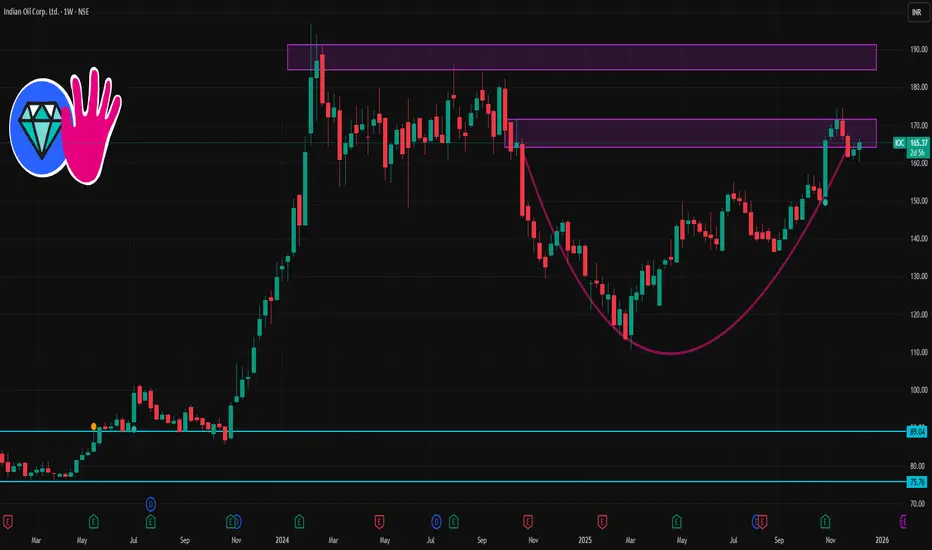
🔎 Current Snapshot
Latest price on NSE: ~ ₹163.00–₹163.50.
52‑week trading range: ₹110.72 (low) ⇒ ₹174.50 (high).
On moving averages: price is above 50‑day, 100‑day and 200‑day MA — a bullish structural sign, though short‑term oscillators are mixed/neutral.
Recent 1‑week performance: modest gains (price near upper of recent short‑term range) — suggests a cautious bullish bias, not a runaway rally.
✅ My “Base‑Case” 1‑Week Scenarios
Scenario A – Mild Bullish (likely): Price hovers between ₹160–165, bouncing off support ~₹160 and possibly testing ₹165–166.
Scenario B – Bullish Breakout (if catalysts align): Break above ₹165–166 → move toward ₹167–168 (maybe touching ₹170).
Scenario C – Weak/Neutral (in adverse market): If oil/market turns negative & price breaks below ₹160, watch for dips toward ₹158–159.
관련 발행물
면책사항
해당 정보와 게시물은 금융, 투자, 트레이딩 또는 기타 유형의 조언이나 권장 사항으로 간주되지 않으며, 트레이딩뷰에서 제공하거나 보증하는 것이 아닙니다. 자세한 내용은 이용 약관을 참조하세요.
관련 발행물
면책사항
해당 정보와 게시물은 금융, 투자, 트레이딩 또는 기타 유형의 조언이나 권장 사항으로 간주되지 않으며, 트레이딩뷰에서 제공하거나 보증하는 것이 아닙니다. 자세한 내용은 이용 약관을 참조하세요.