Timeframe: Daily
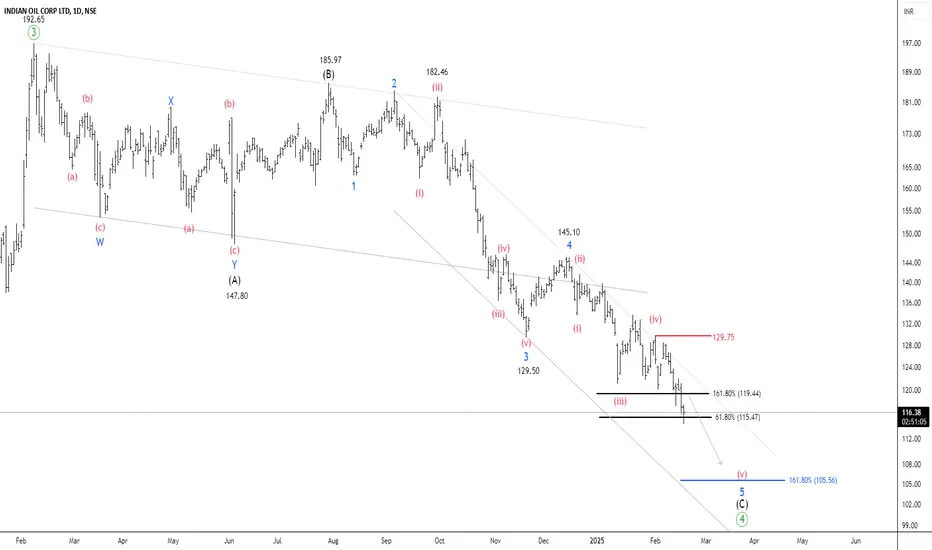
After reaching a high of 196.8, the price has declined by over 39% in 13 weeks. It is currently trading below the 50/100 EMA band, with ATR at 3.68 and ADX at 26.02. According to the Elliott Wave projection, the peak of 196.80 can be identified as a wave ((3)). The security is currently undergoing the formation of a corrective wave (4).
Wave (B) formed at 185.97, while wave 4 of wave (C) was completed at 145.10. NSE IOC is now setting up for the final wave 5 of wave (C).
Two key Fibonacci relationships help estimate the end of the correction:
The price is expected to settle between 115 and 105, which serves as a key demand zone for buyers. If the price breaks out and sustains above 129.75, traders can target the following levels: 139 – 156 – 172+.
we will update further information soon.
After reaching a high of 196.8, the price has declined by over 39% in 13 weeks. It is currently trading below the 50/100 EMA band, with ATR at 3.68 and ADX at 26.02. According to the Elliott Wave projection, the peak of 196.80 can be identified as a wave ((3)). The security is currently undergoing the formation of a corrective wave (4).
Wave (B) formed at 185.97, while wave 4 of wave (C) was completed at 145.10. NSE IOC is now setting up for the final wave 5 of wave (C).
Two key Fibonacci relationships help estimate the end of the correction:
- 1.618 Fibonacci extension of wave (A) at 106.54 (for wave C)
- 0.618 Fibonacci extension of wave 1 at 115.52 (for wave 5)
The price is expected to settle between 115 and 105, which serves as a key demand zone for buyers. If the price breaks out and sustains above 129.75, traders can target the following levels: 139 – 156 – 172+.
we will update further information soon.
액티브 트레이드
Reached 155관련 발행물
면책사항
이 정보와 게시물은 TradingView에서 제공하거나 보증하는 금융, 투자, 거래 또는 기타 유형의 조언이나 권고 사항을 의미하거나 구성하지 않습니다. 자세한 내용은 이용 약관을 참고하세요.
관련 발행물
면책사항
이 정보와 게시물은 TradingView에서 제공하거나 보증하는 금융, 투자, 거래 또는 기타 유형의 조언이나 권고 사항을 의미하거나 구성하지 않습니다. 자세한 내용은 이용 약관을 참고하세요.