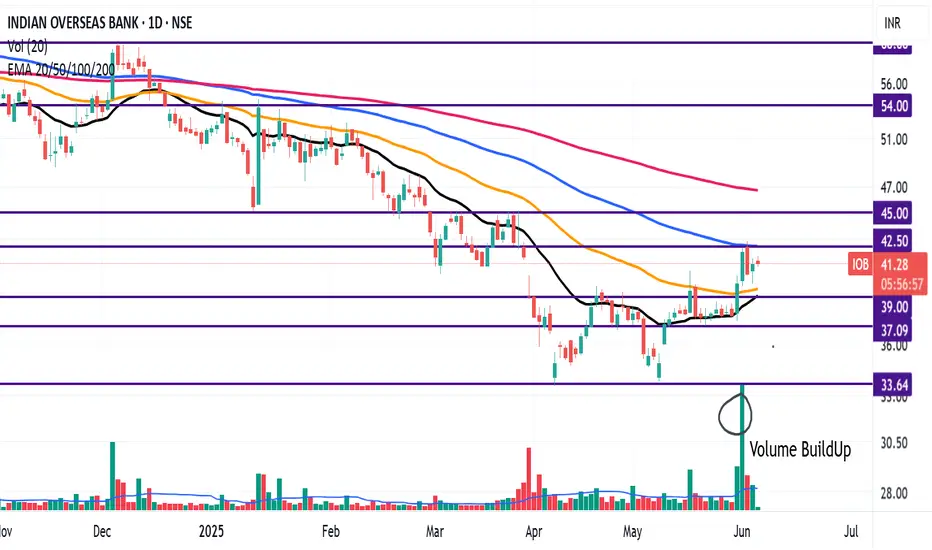
IOB is trading above 20 EMA (black Line), 50 EMA (Orange Line), and nearing the 100 EMAs (Blue Line) However, it is well below the 200 EMA (Pink line).
Recently the stock turned bullish, after taking support around 20EMA.
Volume Buildup also confirms the change in trend.
We have seen spurt in volume in the last few sessions, however, on weekly chart the 20 EMA (Black line) has to traverse above the 50 EMA (Orange line) to confirm the Bullish trend.
Resistance levels: 43, 45, 53, 60
Support levels: 39, 37, 33
면책사항
이 정보와 게시물은 TradingView에서 제공하거나 보증하는 금융, 투자, 거래 또는 기타 유형의 조언이나 권고 사항을 의미하거나 구성하지 않습니다. 자세한 내용은 이용 약관을 참고하세요.
면책사항
이 정보와 게시물은 TradingView에서 제공하거나 보증하는 금융, 투자, 거래 또는 기타 유형의 조언이나 권고 사항을 의미하거나 구성하지 않습니다. 자세한 내용은 이용 약관을 참고하세요.