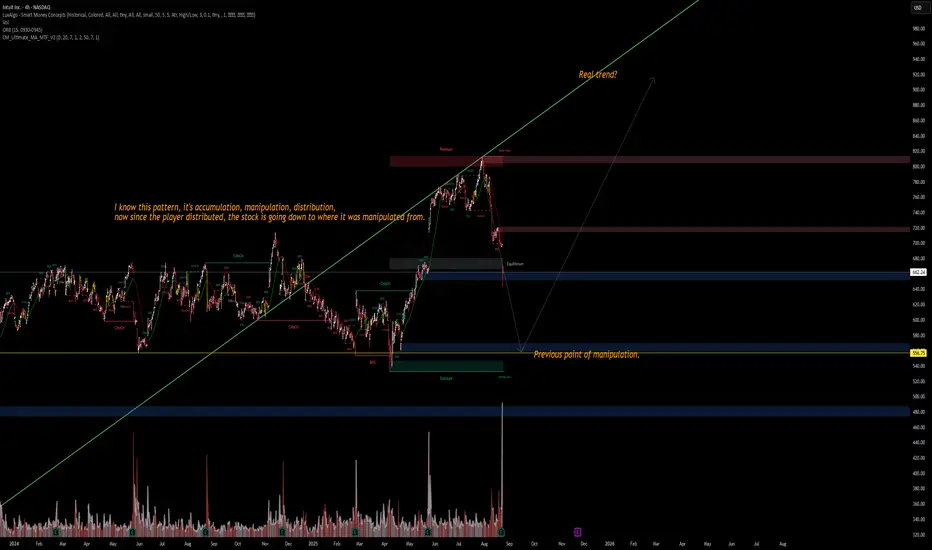
📉 INTU – Market Structure Breakdown
I recognize this setup:
Accumulation ➝ Manipulation ➝ Distribution.
After distribution at the premium zone, price is now breaking down toward the previous point of manipulation.
🔹 Current price: ~662
🔹 Potential downside target: 556–560 zone (previous manipulation base)
🔹 If broken further → risk of deeper move into 480–500 discount range
Key Observations:
Multiple Change of Character (ChoCH) and Break of Structure (BOS) signals confirming distribution.
Volume spikes align with manipulation phases.
Real trend may resume only after price returns to equilibrium zones.
⚠️ Watch for liquidity grabs around 600–610 before continuation lower.
👉 My bias: Short-term bearish, targeting 560, with a potential trend resumption later.
#INTU #Trading #SmartMoney #Stocks
면책사항
이 정보와 게시물은 TradingView에서 제공하거나 보증하는 금융, 투자, 거래 또는 기타 유형의 조언이나 권고 사항을 의미하거나 구성하지 않습니다. 자세한 내용은 이용 약관을 참고하세요.
면책사항
이 정보와 게시물은 TradingView에서 제공하거나 보증하는 금융, 투자, 거래 또는 기타 유형의 조언이나 권고 사항을 의미하거나 구성하지 않습니다. 자세한 내용은 이용 약관을 참고하세요.