📈
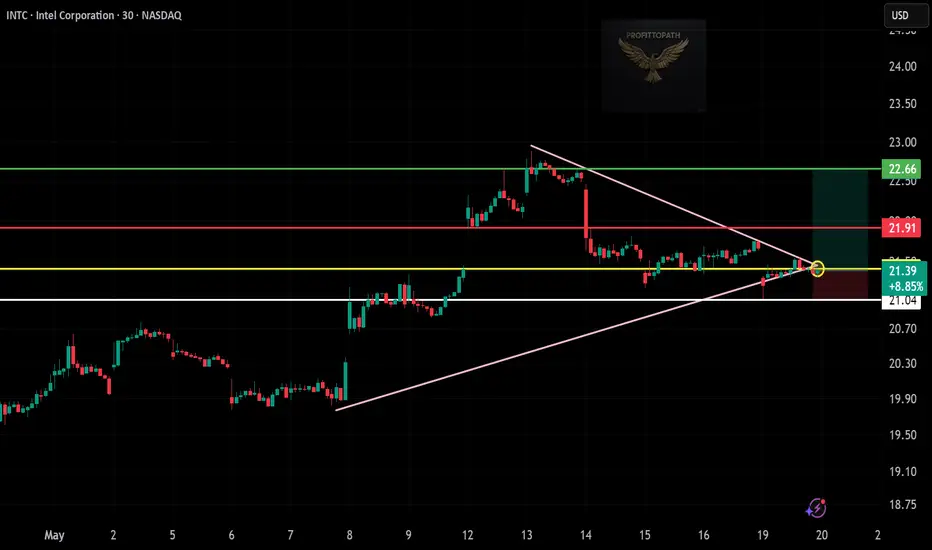
Current Price: $21.39
Pattern: Symmetrical triangle breakout (neutral-to-bullish bias)
Entry Zone: ~$21.39 (breakout confirmation)
Stop-Loss (SL): $21.04 (below triangle base/support)
Targets:
TP1: $21.91 (resistance – red line)
TP2: $22.66 (major resistance zone – green line)
🧠 Technical Highlights
Price has broken out of a tightening triangle pattern.
Yellow resistance flipped to support.
Volume not shown clearly but breakout candle shows good body.
Risk/Reward: Favorable at ~1:2 if targets hold.
🎯 Bias:
Bullish above $21.04.
Neutral or bearish below this zone.
면책사항
해당 정보와 게시물은 금융, 투자, 트레이딩 또는 기타 유형의 조언이나 권장 사항으로 간주되지 않으며, 트레이딩뷰에서 제공하거나 보증하는 것이 아닙니다. 자세한 내용은 이용 약관을 참조하세요.
면책사항
해당 정보와 게시물은 금융, 투자, 트레이딩 또는 기타 유형의 조언이나 권장 사항으로 간주되지 않으며, 트레이딩뷰에서 제공하거나 보증하는 것이 아닙니다. 자세한 내용은 이용 약관을 참조하세요.