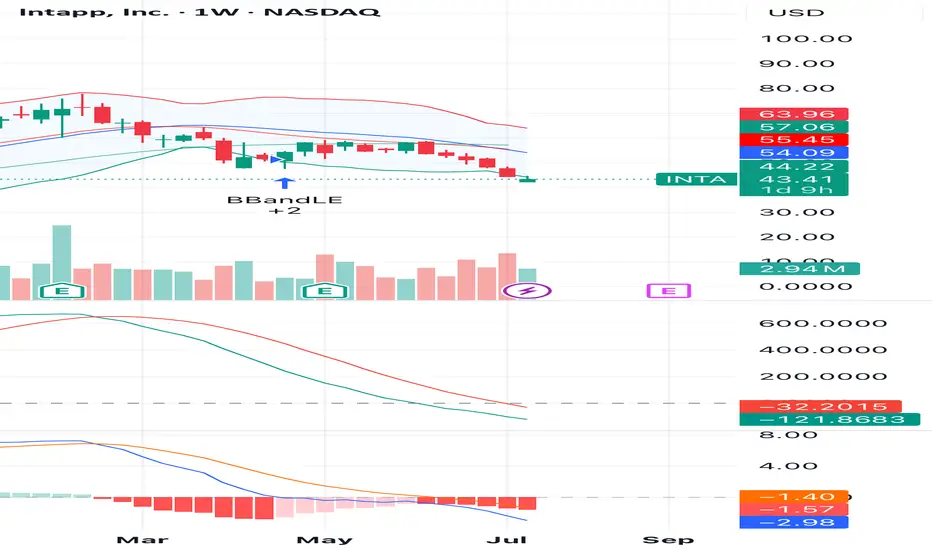
INTA is showing signs of a potential reversal after a consistent downtrend. On the weekly chart, the price touched the lower Bollinger Band with increased buying volume and a bullish candle forming. This may signal the end of the selling pressure.
Momentum indicators such as MACD and KST are flattening, suggesting a possible shift in momentum. A break above $44.22 could confirm a short-term bounce.
📈 Entry Zone: $43.00 – $44.50
🎯 Target 1: $54.00
🎯 Target 2: $57.00
🛑 Stop Loss: Below $41.00
This idea is based on technical signals; monitor volume and market conditions closely.
면책사항
해당 정보와 게시물은 금융, 투자, 트레이딩 또는 기타 유형의 조언이나 권장 사항으로 간주되지 않으며, 트레이딩뷰에서 제공하거나 보증하는 것이 아닙니다. 자세한 내용은 이용 약관을 참조하세요.
면책사항
해당 정보와 게시물은 금융, 투자, 트레이딩 또는 기타 유형의 조언이나 권장 사항으로 간주되지 않으며, 트레이딩뷰에서 제공하거나 보증하는 것이 아닙니다. 자세한 내용은 이용 약관을 참조하세요.