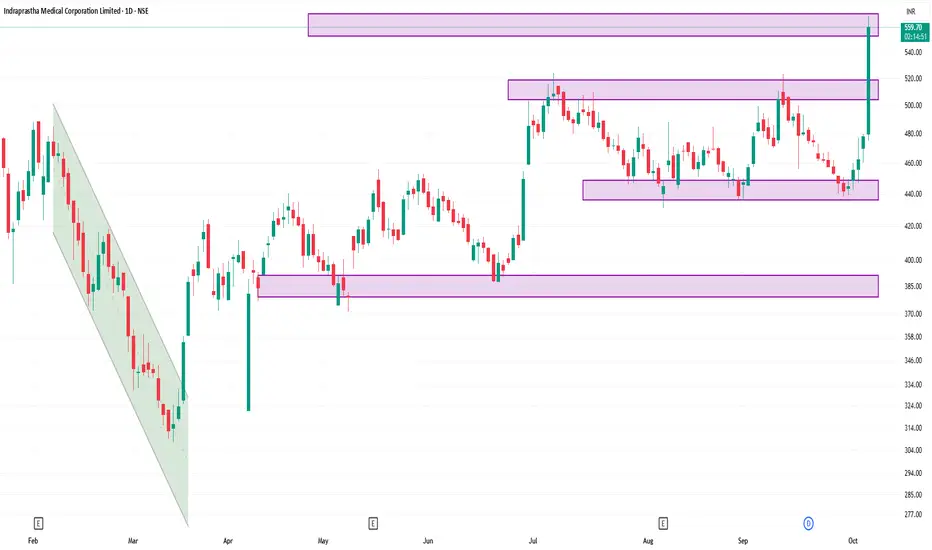
Technical Overview:
Overall Signal: Strong Buy
Moving Averages: All moving averages (5, 10, 20, 50, 100, 200) are indicating a Buy signal.
RSI (14): 90.29 – Overbought (indicates strong upward momentum)
MACD: 24.38 – Positive (supports bullish trend)
Stochastic RSI: 95.20 – Overbought (suggests potential for a pullback)
CCI (14): 194.96 – Positive (indicates strong trend strength)
ADX (14): 35.55 – Strong trend (above 25 indicates a strong trend)
ATR (14): 14.44 – High volatility (indicates significant price movement)
Pivot Points:
Resistance Levels: R1: ₹565.46, R2: ₹570.23, R3: ₹577.96
Support Levels: S1: ₹552.96, S2: ₹545.23, S3: ₹540.46
Price Action:
Current Price: ₹559.50
Day Range: ₹475.00 – ₹568.90
Previous Close: ₹478.10
Volume: Approximately 4.5 million shares traded
VWAP: ₹541.59
52-Week High/Low: ₹572.00 / ₹307.25
Summary:
The stock is currently trading near its 52-week high, indicating strong investor confidence. Technical indicators suggest a robust bullish trend, though the overbought conditions (RSI and Stochastic RSI) may imply a potential short-term pullback. Traders should monitor for any signs of reversal or consolidation near resistance levels.
관련 발행물
면책사항
해당 정보와 게시물은 금융, 투자, 트레이딩 또는 기타 유형의 조언이나 권장 사항으로 간주되지 않으며, 트레이딩뷰에서 제공하거나 보증하는 것이 아닙니다. 자세한 내용은 이용 약관을 참조하세요.
관련 발행물
면책사항
해당 정보와 게시물은 금융, 투자, 트레이딩 또는 기타 유형의 조언이나 권장 사항으로 간주되지 않으며, 트레이딩뷰에서 제공하거나 보증하는 것이 아닙니다. 자세한 내용은 이용 약관을 참조하세요.