⚠️ Disclaimer: This chart is for educational purposes only.
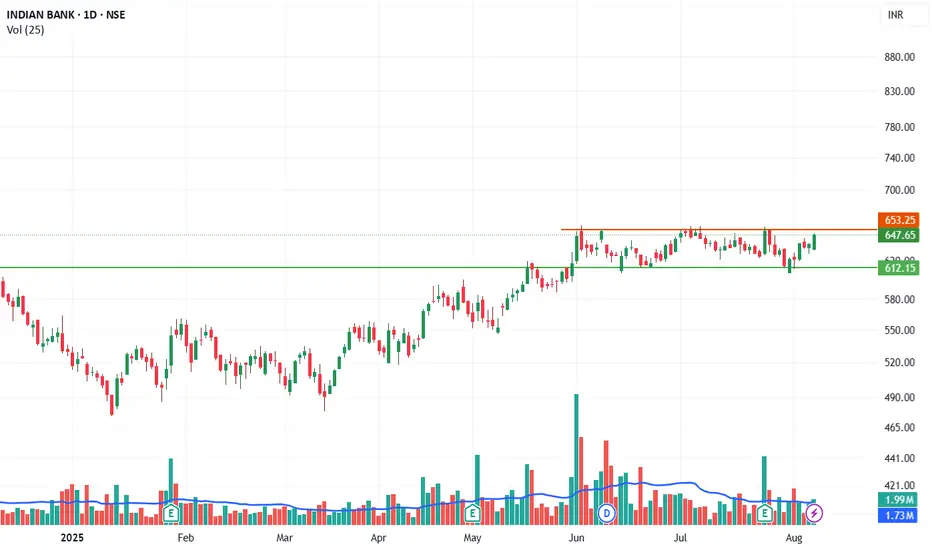
Price Action & Resistance Analysis
Current Market Price: ₹647
Upper Resistance Zone: ₹653
This level has been tested multiple times since early June but has not yet been convincingly broken, indicating a strong horizontal resistance.
Support Level: ₹610
This is a well-defined support line that has held multiple times in the last couple of months. It marks the lower bound of the consolidation zone.
Price Structure:
The stock is in a broad consolidation range between ₹612 and ₹653 for over two months.
Repeated higher lows within this range show a bullish bias and buildup towards a potential breakout.
The stock is currently approaching the resistance zone again, which indicates a third or fourth retest—often a precursor to a breakout.
Technical Outlook & Strategy
Bias: Moderately Bullish (until breakout confirmation)
Breakout Trigger: Daily close above ₹653.25 with volume > 2.5M
Short-Term Target (Post Breakout): ₹680 – ₹700
Stop Loss for Longs: Below ₹610 (strong support level)
Indian Bank is currently in a tight range between ₹612 and ₹653, with signs of accumulation and strengthening momentum. A breakout above ₹653.25 with convincing volume could unlock the next leg up. Traders should watch for a volume-backed move above resistance, while investors may consider this as a potential accumulation zone before a medium-term rally.
Regulatory Note: We are an independent development team. Our services are not registered or licensed by any regulatory body in India, the U.S., the U.K., or any global financial authority. Please consult a licensed advisor before making trading decisions.
Creator of “VaultSignal Weekly, SignalSurge Daily, ProChart Future Hourly, – Invite-only scripts. Access available via profile. t.me/+Mdc4fo9qxn8zNzI1
면책사항
이 정보와 게시물은 TradingView에서 제공하거나 보증하는 금융, 투자, 거래 또는 기타 유형의 조언이나 권고 사항을 의미하거나 구성하지 않습니다. 자세한 내용은 이용 약관을 참고하세요.
Creator of “VaultSignal Weekly, SignalSurge Daily, ProChart Future Hourly, – Invite-only scripts. Access available via profile. t.me/+Mdc4fo9qxn8zNzI1
면책사항
이 정보와 게시물은 TradingView에서 제공하거나 보증하는 금융, 투자, 거래 또는 기타 유형의 조언이나 권고 사항을 의미하거나 구성하지 않습니다. 자세한 내용은 이용 약관을 참고하세요.