📈 Key Recent Data & Context
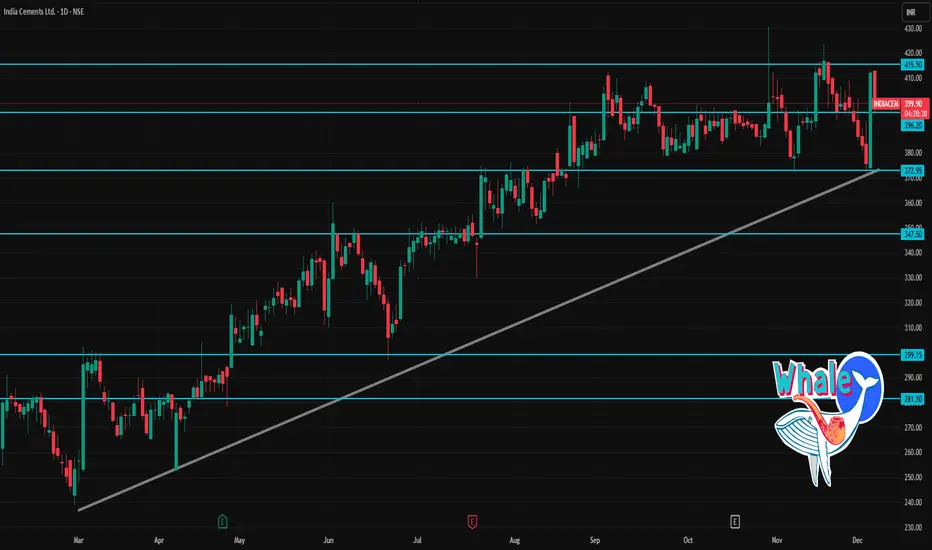
Recent closing price was ~ ₹412.15, with VWAP ~ ₹402.10. That means price closed above VWAP — often seen as a short-term bullish signal.
The stock has experienced a significant volume spike recently (much higher than its 2-week average), which may suggest stronger conviction in current move.
According to one daily technical indicator set, the stock shows “neutral to slightly bullish” — RSI near mid-range, MACD modestly positive.
🔎 1-Day Pivot & Support / Resistance Levels
Using standard pivot-point calculations for INDIACEM:
Level Type Price (₹)
Daily Pivot 364.95
Support 1 (S1) 359.90
Support 2 (S2) 351.00
Support 3 (S3) 345.95
Resistance 1 (R1) 373.85
Resistance 2 (R2) 378.90
Resistance 3 (R3) 387.80
Interpretation:
If price retraces, the pivot ~ ₹365 may act as first “balancing” zone.
Key supports below are between ₹346–351 — failure below could weaken short-term bullishness.
Upside resistances from today’s pivot are ₹374 → ₹379 → ₹388 — crossing these may signal stronger bullish momentum for the day.
✅ My Trading-day “Game Plan” (Hypothetical)
If I were trading INDIACEM today (intraday or short-term):
Could consider a long entry if the stock sustains above ₹402–405, with stop-loss near ₹377–380 (just below R2/R3).
If price slips back and tests pivot ~ ₹365 or support ~ ₹350–355, that could be a buy-on-dip zone.
On the upside, a move beyond ₹388 could open up short-term upside toward ₹395–405 (given stock’s recent volatility).
관련 발행물
면책사항
해당 정보와 게시물은 금융, 투자, 트레이딩 또는 기타 유형의 조언이나 권장 사항으로 간주되지 않으며, 트레이딩뷰에서 제공하거나 보증하는 것이 아닙니다. 자세한 내용은 이용 약관을 참조하세요.
관련 발행물
면책사항
해당 정보와 게시물은 금융, 투자, 트레이딩 또는 기타 유형의 조언이나 권장 사항으로 간주되지 않으며, 트레이딩뷰에서 제공하거나 보증하는 것이 아닙니다. 자세한 내용은 이용 약관을 참조하세요.