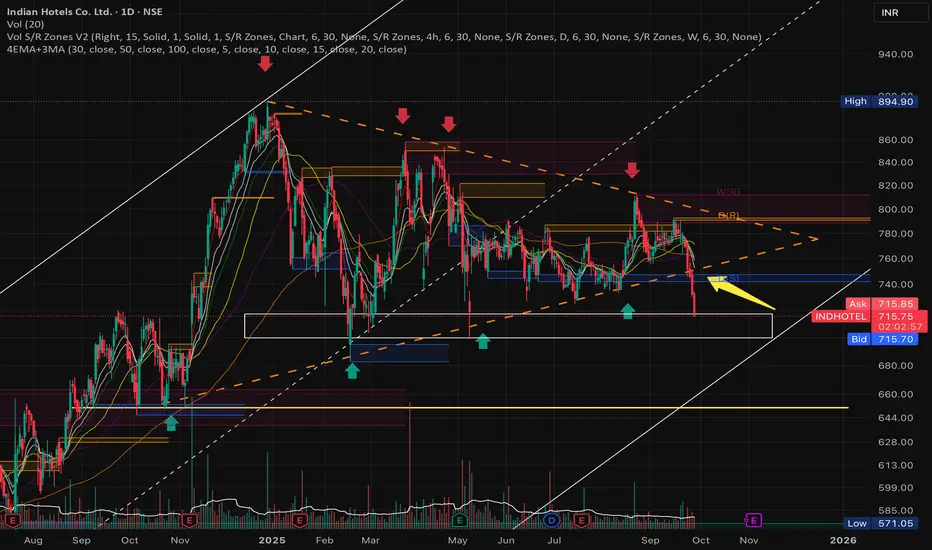
The chart has formed a symmetrical triangle pattern, which has taken shape over approximately 270 days. This pattern was recently broken, and a new support level has emerged around 713.
If the 713 support fails to hold, the next potential downside targets are 703, 695, and 685.
However, it's important to note that the stock remains in a broader upward trend, as illustrated by the ascending channel. As long as the price stays within this channel, any pullback toward the lower boundary could present a potential buying opportunity, suggesting a continuation of the uptrend.
Caution:
If the stock breaks below the channel, the current trend structure would be invalidated, and a fresh analysis would be required to reassess the setup.
면책사항
이 정보와 게시물은 TradingView에서 제공하거나 보증하는 금융, 투자, 거래 또는 기타 유형의 조언이나 권고 사항을 의미하거나 구성하지 않습니다. 자세한 내용은 이용 약관을 참고하세요.
면책사항
이 정보와 게시물은 TradingView에서 제공하거나 보증하는 금융, 투자, 거래 또는 기타 유형의 조언이나 권고 사항을 의미하거나 구성하지 않습니다. 자세한 내용은 이용 약관을 참고하세요.