A technical review of  IMOS reveals a constructive setup following its recent earnings report, suggesting the potential for a continued upward trajectory. The convergence of a fundamental catalyst and a recognizable bullish pattern provides a framework for assessing future price movement.
1. Fundamental Catalyst: Solid Earnings Report
The company's earnings release on Tuesday, November 11th, served as a significant fundamental catalyst. Your characterization that the company "did okay" is interpreted as the results meeting or modestly exceeding market expectations. This positive news has likely instilled confidence, providing a fundamental underpinning for the current price action and the formation of the subsequent bullish pattern.
2. Pattern Analysis: The Emerging Bull Flag
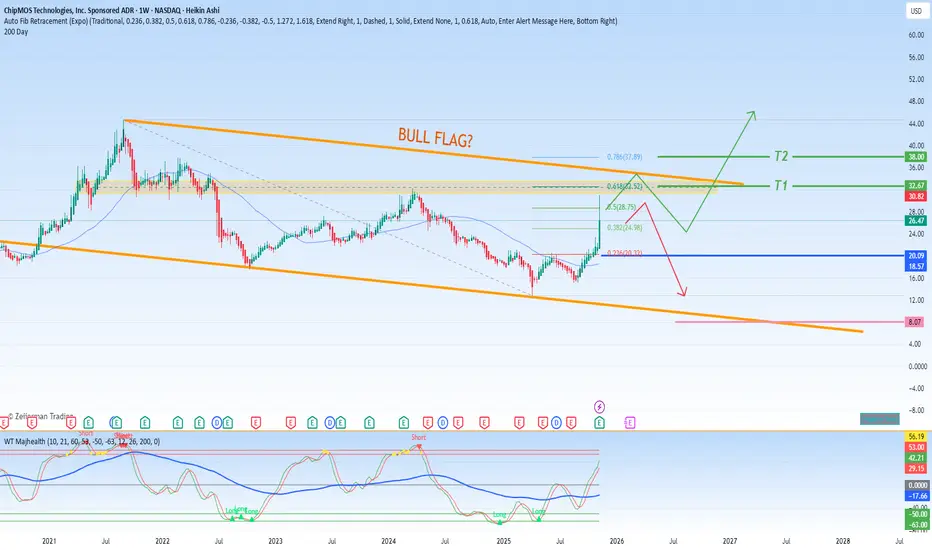
The post-earnings price action is potentially forming a Bull Flag pattern, which is a common and often reliable continuation signal.
Pattern Structure: This pattern typically consists of a sharp upward move (the "flagpole"), fueled in this case by the positive earnings reaction, followed by a period of sideways or slightly downward-sloping consolidation (the "flag") on declining volume.
Current Status: The stock appears to be in this consolidation phase. The "flag" represents a brief pause where the market digests the recent gains before deciding on the next direction. A breakout above the upper boundary of this flag would confirm the pattern and signal the resumption of the prior uptrend.
3. Fibonacci Framework: Defining Risk and Reward
Applying Fibonacci retracement levels to the recent upswing (likely from pre-earnings to the post-earnings high) provides a mathematical basis for setting profit targets and a strategic stop-loss.
Support & Stop-Loss (The 0.236 Level):
The 0.236 Fibonacci level at $20.32 represents a shallow and healthy retracement. This level should now be viewed as a key support zone. From a risk management perspective, a decisive break below $20.32 would call the bull flag thesis into question and could trigger a deeper pullback. Therefore, this level serves as a logical line for a protective stop-loss.
Profit-Taking Targets (Upside Objectives):
The measured move of a bull flag often projects a move equal to the length of the initial flagpole. The Fibonacci extension levels provide precise targets for this projection. Our primary take-profit zones are:
Primary Target (0.618): $32.52. This is a standard first profit-taking level and often coincides with the flag pattern's minimum measured move target.
Extended Target (0.786): $37.89. If buying pressure is particularly strong and the breakout is powerful, a move toward this second, higher target becomes probable. This represents a more ambitious take-profit zone.
Synthesis and Strategic Outlook
In summary,IMOS is exhibiting the technical hallmarks of a healthy uptrend taking a breather. The positive earnings report provided the initial thrust, and the current consolidation forms a potential launchpad for the next leg higher.
Key Levels to Watch:
Confirmation Trigger: A decisive breakout above the upper trendline of the developing bull flag pattern.
Support/Stop-Loss: $20.32 (0.236 Fib). Hold for continuation; break for invalidation.
Profit Target 1: $32.52 (0.618 Fib)
Profit Target 2: $37.89 (0.786 Fib)
The strategy is to monitor the price action at the flag's resistance and the key Fibonacci support. A successful breakout above resistance would activate the bullish targets, while a failure to hold $20.32 would suggest a need to re-evaluate the bullish premise.
1. Fundamental Catalyst: Solid Earnings Report
The company's earnings release on Tuesday, November 11th, served as a significant fundamental catalyst. Your characterization that the company "did okay" is interpreted as the results meeting or modestly exceeding market expectations. This positive news has likely instilled confidence, providing a fundamental underpinning for the current price action and the formation of the subsequent bullish pattern.
2. Pattern Analysis: The Emerging Bull Flag
The post-earnings price action is potentially forming a Bull Flag pattern, which is a common and often reliable continuation signal.
Pattern Structure: This pattern typically consists of a sharp upward move (the "flagpole"), fueled in this case by the positive earnings reaction, followed by a period of sideways or slightly downward-sloping consolidation (the "flag") on declining volume.
Current Status: The stock appears to be in this consolidation phase. The "flag" represents a brief pause where the market digests the recent gains before deciding on the next direction. A breakout above the upper boundary of this flag would confirm the pattern and signal the resumption of the prior uptrend.
3. Fibonacci Framework: Defining Risk and Reward
Applying Fibonacci retracement levels to the recent upswing (likely from pre-earnings to the post-earnings high) provides a mathematical basis for setting profit targets and a strategic stop-loss.
Support & Stop-Loss (The 0.236 Level):
The 0.236 Fibonacci level at $20.32 represents a shallow and healthy retracement. This level should now be viewed as a key support zone. From a risk management perspective, a decisive break below $20.32 would call the bull flag thesis into question and could trigger a deeper pullback. Therefore, this level serves as a logical line for a protective stop-loss.
Profit-Taking Targets (Upside Objectives):
The measured move of a bull flag often projects a move equal to the length of the initial flagpole. The Fibonacci extension levels provide precise targets for this projection. Our primary take-profit zones are:
Primary Target (0.618): $32.52. This is a standard first profit-taking level and often coincides with the flag pattern's minimum measured move target.
Extended Target (0.786): $37.89. If buying pressure is particularly strong and the breakout is powerful, a move toward this second, higher target becomes probable. This represents a more ambitious take-profit zone.
Synthesis and Strategic Outlook
In summary,
Key Levels to Watch:
Confirmation Trigger: A decisive breakout above the upper trendline of the developing bull flag pattern.
Support/Stop-Loss: $20.32 (0.236 Fib). Hold for continuation; break for invalidation.
Profit Target 1: $32.52 (0.618 Fib)
Profit Target 2: $37.89 (0.786 Fib)
The strategy is to monitor the price action at the flag's resistance and the key Fibonacci support. A successful breakout above resistance would activate the bullish targets, while a failure to hold $20.32 would suggest a need to re-evaluate the bullish premise.
면책사항
해당 정보와 게시물은 금융, 투자, 트레이딩 또는 기타 유형의 조언이나 권장 사항으로 간주되지 않으며, 트레이딩뷰에서 제공하거나 보증하는 것이 아닙니다. 자세한 내용은 이용 약관을 참조하세요.
면책사항
해당 정보와 게시물은 금융, 투자, 트레이딩 또는 기타 유형의 조언이나 권장 사항으로 간주되지 않으며, 트레이딩뷰에서 제공하거나 보증하는 것이 아닙니다. 자세한 내용은 이용 약관을 참조하세요.