📊 Current snapshot
Last quoted price: approx ₹540.75 (as of 11 Nov 2025).
1-week return: ~ +0.09%.
52-week high / low: ~ ₹559.75 / ~ ₹279.80.
🔍 1-Week level view
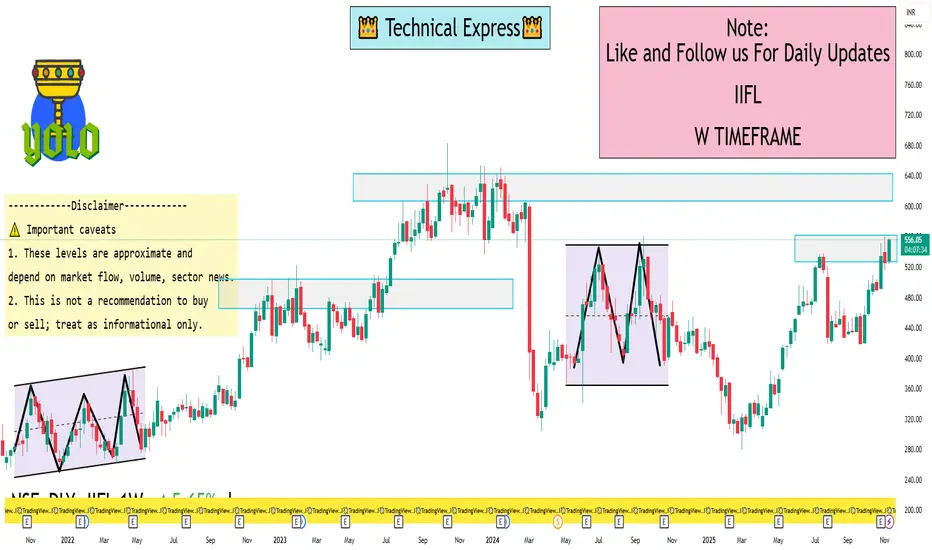
Given the current price and recent behaviour, here are some approximate support/resistance zones for the coming week:
Support zone: around ₹ 520-530. (if price dips, this may be an area where buyers step in)
Resistance zone: around ₹ 555-560. (near the recent high end of the range)
Neutral range: ~₹ 530-550 — staying in this band if no strong momentum emerges.
Upside breakout scenario: if it convincingly breaks above ~₹ 560, the next target may be ~₹ 570-580.
Downside break scenario: if it falls below ~₹ 520, it could test ~₹ 500 or lower in the short term.
⚠️ Important caveats
These levels are approximate and depend on market flow, volume, sector news.
This is not a recommendation to buy or sell; treat as informational only.
NBFC stocks like IIFL can be sensitive to credit/regulation news, which can quickly shift the technicals.
The “1-week” view means the horizon is short; volatility could cause levels to be breached.
Last quoted price: approx ₹540.75 (as of 11 Nov 2025).
1-week return: ~ +0.09%.
52-week high / low: ~ ₹559.75 / ~ ₹279.80.
🔍 1-Week level view
Given the current price and recent behaviour, here are some approximate support/resistance zones for the coming week:
Support zone: around ₹ 520-530. (if price dips, this may be an area where buyers step in)
Resistance zone: around ₹ 555-560. (near the recent high end of the range)
Neutral range: ~₹ 530-550 — staying in this band if no strong momentum emerges.
Upside breakout scenario: if it convincingly breaks above ~₹ 560, the next target may be ~₹ 570-580.
Downside break scenario: if it falls below ~₹ 520, it could test ~₹ 500 or lower in the short term.
⚠️ Important caveats
These levels are approximate and depend on market flow, volume, sector news.
This is not a recommendation to buy or sell; treat as informational only.
NBFC stocks like IIFL can be sensitive to credit/regulation news, which can quickly shift the technicals.
The “1-week” view means the horizon is short; volatility could cause levels to be breached.
I built a Buy & Sell Signal Indicator with 85% accuracy.
📈 Get access via DM or
WhatsApp: wa.link/d997q0
Contact - +91 76782 40962
| Email: techncialexpress@gmail.com
| Script Coder | Trader | Investor | From India
📈 Get access via DM or
WhatsApp: wa.link/d997q0
Contact - +91 76782 40962
| Email: techncialexpress@gmail.com
| Script Coder | Trader | Investor | From India
관련 발행물
면책사항
해당 정보와 게시물은 금융, 투자, 트레이딩 또는 기타 유형의 조언이나 권장 사항으로 간주되지 않으며, 트레이딩뷰에서 제공하거나 보증하는 것이 아닙니다. 자세한 내용은 이용 약관을 참조하세요.