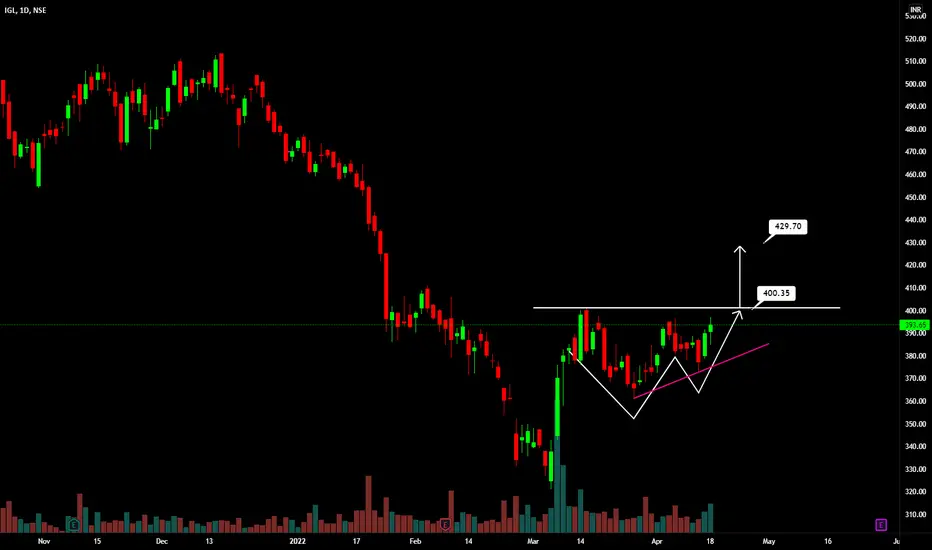
Above chart is a daily chart of IGL.
Double bottom pattern with higher low is visible.
Breaking above 400 will active the trade.
Potential target 430.
Double bottom pattern with higher low is visible.
Breaking above 400 will active the trade.
Potential target 430.
면책사항
이 정보와 게시물은 TradingView에서 제공하거나 보증하는 금융, 투자, 거래 또는 기타 유형의 조언이나 권고 사항을 의미하거나 구성하지 않습니다. 자세한 내용은 이용 약관을 참고하세요.
면책사항
이 정보와 게시물은 TradingView에서 제공하거나 보증하는 금융, 투자, 거래 또는 기타 유형의 조언이나 권고 사항을 의미하거나 구성하지 않습니다. 자세한 내용은 이용 약관을 참고하세요.