STOCK Daily Time Frame Reversal On Support
1. Price Action
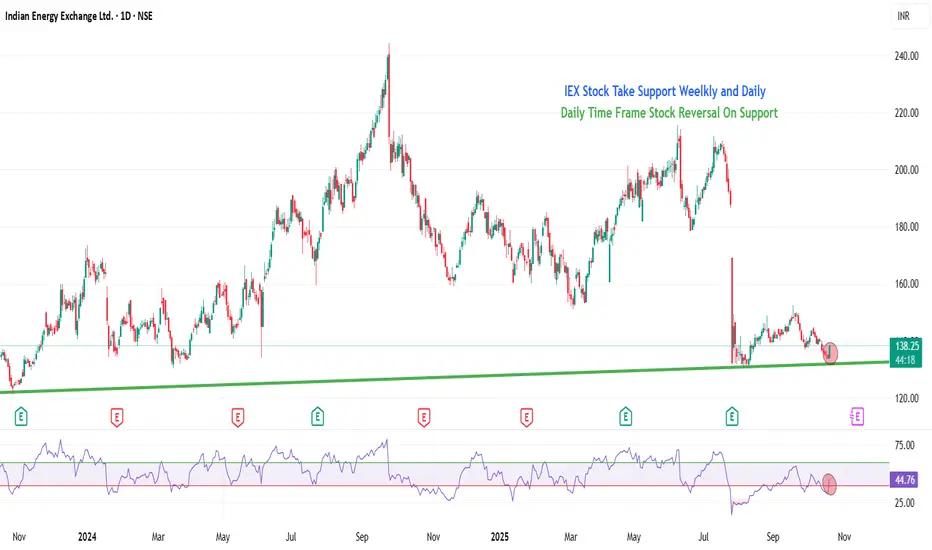
The stock is trading around 138, which is exactly at its 52-week low and a historical support zone from 2021.
Bullish Candle Stick Patterns is forming at support.
2. RSI (Relative Strength Index)
RSI at 44 → has moved from oversold to buying zone.
5. Support and Resistance
Immediate support: 134 (current zone). This Support will act as our stop loss.
Upside swing targets: ₹170 → ₹210
Note: This chart is for study and educational purposes only. Not a trade recommendation. Please do your own analysis and risk assessment before taking any action.
Disclaimer
The information and publications are not meant to be, and do not constitute, financial, investment, trading, or other types of advice or recommendations.
1. Price Action
The stock is trading around 138, which is exactly at its 52-week low and a historical support zone from 2021.
Bullish Candle Stick Patterns is forming at support.
2. RSI (Relative Strength Index)
RSI at 44 → has moved from oversold to buying zone.
5. Support and Resistance
Immediate support: 134 (current zone). This Support will act as our stop loss.
Upside swing targets: ₹170 → ₹210
Note: This chart is for study and educational purposes only. Not a trade recommendation. Please do your own analysis and risk assessment before taking any action.
Disclaimer
The information and publications are not meant to be, and do not constitute, financial, investment, trading, or other types of advice or recommendations.
Hari Pratap
관련 발행물
면책사항
해당 정보와 게시물은 금융, 투자, 트레이딩 또는 기타 유형의 조언이나 권장 사항으로 간주되지 않으며, 트레이딩뷰에서 제공하거나 보증하는 것이 아닙니다. 자세한 내용은 이용 약관을 참조하세요.
Hari Pratap
관련 발행물
면책사항
해당 정보와 게시물은 금융, 투자, 트레이딩 또는 기타 유형의 조언이나 권장 사항으로 간주되지 않으며, 트레이딩뷰에서 제공하거나 보증하는 것이 아닙니다. 자세한 내용은 이용 약관을 참조하세요.