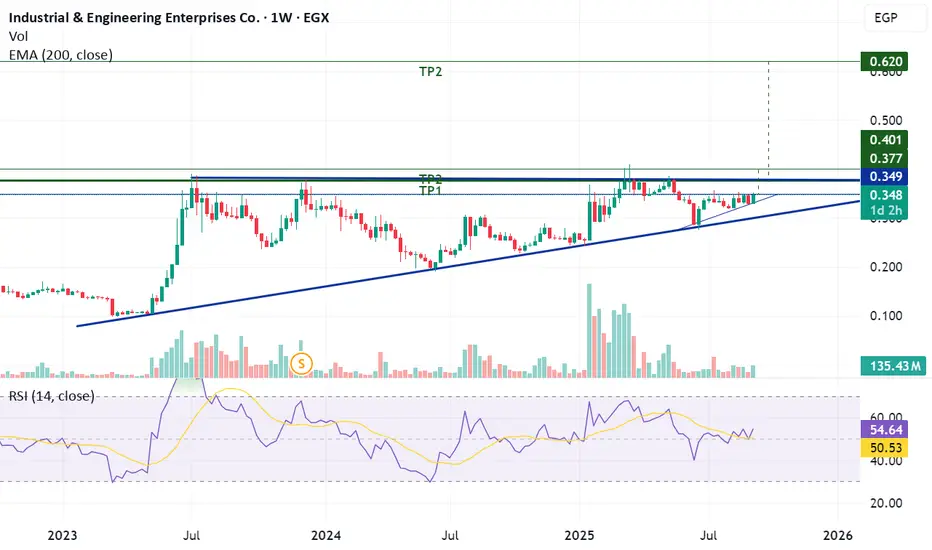
On the weekly chart, the stock is forming an ascending triangle. On the daily chart, it is also moving within a smaller ascending triangle.
- Short term: If the price breaks 0.35 and holds above it, targets are 0.378 – 0.40.
- Medium to long term: If the price stabilizes above 0.40, the target becomes 0.62 (measured target of the ascending triangle on the weekly chart).
⚠ Stop loss after confirming above 0.35: 0.33
면책사항
이 정보와 게시물은 TradingView에서 제공하거나 보증하는 금융, 투자, 거래 또는 기타 유형의 조언이나 권고 사항을 의미하거나 구성하지 않습니다. 자세한 내용은 이용 약관을 참고하세요.
면책사항
이 정보와 게시물은 TradingView에서 제공하거나 보증하는 금융, 투자, 거래 또는 기타 유형의 조언이나 권고 사항을 의미하거나 구성하지 않습니다. 자세한 내용은 이용 약관을 참고하세요.