Vodafone Idea (VI) chart pattern analysis + fundamentals + peer comparison + learnings
-Technical Chart Analysis – Vodafone Idea (Weekly)
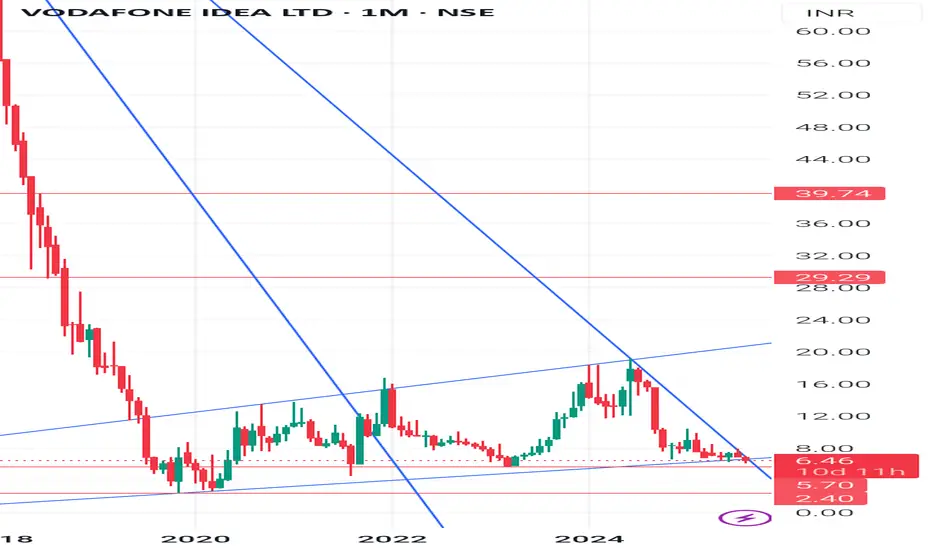
-CMP (Current Market Price): 6.46 (+5.04%)
-Trend: Stock has been in a long-term downtrend since 2018.
👉Key Support Levels:
5.70 (immediate)
4.20 (medium-term)
2.40 (long-term bottom)
👉Resistance Levels:
8.50 (immediate)
12.20 (medium-term)
16.80, then 29.3 & 39.7 (long-term hurdles)
👉Pattern Observation:
Price is struggling near a channel support line.
Stock is in a make-or-break zone – either bounces back from current support or risks sliding further.
Any weekly close above 8.5 will confirm strength and may lead to 12–16 zone.
👉 Fundamental Comparison (Vodafone Idea vs Competitors)
(FY24 / recent data approx)
Company Revenue ( Cr) Net Profit Debt ( Cr) Market Share (Telecom) P/E Ratio ARPU (Avg Revenue/User)
Vodafone Idea - 42,000 Loss (-29,000 Cr) - 2.1 lakh Cr - 19% NA (Loss-making) - 145
Bharti Airtel - 1.4 lakh Cr Profit (- 8,300 Cr) - 1.6 lakh Cr - 33% - 68x - 208
Reliance Jio - 98,000 Cr Profit (- 20,000 Cr) - 1.1 lakh Cr - 38% - 22x - 182
🔑 Key Observations:
-VI is the only loss-making player in top 3.
-Heavy debt (- 2.1 lakh Cr) makes survival tough without tariff hikes or govt. relief.
-ARPU (revenue per customer) is lowest among peers, which shows weak monetization.
-Airtel & Jio are fundamentally stronger with consistent profits.
👉 Basic Learnings for Students / New Investors
1. Chart Patterns Reflect History – A stock in downtrend for years (like VI) shows structural weakness; don’t catch falling knives without reason.
2. Support & Resistance Levels – Help in risk management; always watch where the stock can bounce or fall.
3. Debt is a Red Flag – Too much borrowing restricts growth; fundamentals matter more than temporary price spikes.
4. Compare with Competitors – If peers are profitable (Airtel, Jio) and one is struggling (VI), investors must be cautious.
5. Turnaround Bets are Risky – Such stocks may give multi-bagger returns if revived, or wipe out wealth if debt crushes survival.
Disclaimer👉
This analysis is for educational purposes only. It is not financial advice or stock recommendation. Always consult a SEBI-registered advisor before investing. Market investments carry risk.
#VodafoneIdea #StockMarketIndia #TechnicalAnalysis #FundamentalAnalysis #Airtel #RelianceJio #TelecomSector #StockMarketForBeginners #InvestmentLearning #SupportResistance #ChartAnalysis
-Technical Chart Analysis – Vodafone Idea (Weekly)
-CMP (Current Market Price): 6.46 (+5.04%)
-Trend: Stock has been in a long-term downtrend since 2018.
👉Key Support Levels:
5.70 (immediate)
4.20 (medium-term)
2.40 (long-term bottom)
👉Resistance Levels:
8.50 (immediate)
12.20 (medium-term)
16.80, then 29.3 & 39.7 (long-term hurdles)
👉Pattern Observation:
Price is struggling near a channel support line.
Stock is in a make-or-break zone – either bounces back from current support or risks sliding further.
Any weekly close above 8.5 will confirm strength and may lead to 12–16 zone.
👉 Fundamental Comparison (Vodafone Idea vs Competitors)
(FY24 / recent data approx)
Company Revenue ( Cr) Net Profit Debt ( Cr) Market Share (Telecom) P/E Ratio ARPU (Avg Revenue/User)
Vodafone Idea - 42,000 Loss (-29,000 Cr) - 2.1 lakh Cr - 19% NA (Loss-making) - 145
Bharti Airtel - 1.4 lakh Cr Profit (- 8,300 Cr) - 1.6 lakh Cr - 33% - 68x - 208
Reliance Jio - 98,000 Cr Profit (- 20,000 Cr) - 1.1 lakh Cr - 38% - 22x - 182
🔑 Key Observations:
-VI is the only loss-making player in top 3.
-Heavy debt (- 2.1 lakh Cr) makes survival tough without tariff hikes or govt. relief.
-ARPU (revenue per customer) is lowest among peers, which shows weak monetization.
-Airtel & Jio are fundamentally stronger with consistent profits.
👉 Basic Learnings for Students / New Investors
1. Chart Patterns Reflect History – A stock in downtrend for years (like VI) shows structural weakness; don’t catch falling knives without reason.
2. Support & Resistance Levels – Help in risk management; always watch where the stock can bounce or fall.
3. Debt is a Red Flag – Too much borrowing restricts growth; fundamentals matter more than temporary price spikes.
4. Compare with Competitors – If peers are profitable (Airtel, Jio) and one is struggling (VI), investors must be cautious.
5. Turnaround Bets are Risky – Such stocks may give multi-bagger returns if revived, or wipe out wealth if debt crushes survival.
Disclaimer👉
This analysis is for educational purposes only. It is not financial advice or stock recommendation. Always consult a SEBI-registered advisor before investing. Market investments carry risk.
#VodafoneIdea #StockMarketIndia #TechnicalAnalysis #FundamentalAnalysis #Airtel #RelianceJio #TelecomSector #StockMarketForBeginners #InvestmentLearning #SupportResistance #ChartAnalysis
관련 발행물
면책사항
해당 정보와 게시물은 금융, 투자, 트레이딩 또는 기타 유형의 조언이나 권장 사항으로 간주되지 않으며, 트레이딩뷰에서 제공하거나 보증하는 것이 아닙니다. 자세한 내용은 이용 약관을 참조하세요.
관련 발행물
면책사항
해당 정보와 게시물은 금융, 투자, 트레이딩 또는 기타 유형의 조언이나 권장 사항으로 간주되지 않으며, 트레이딩뷰에서 제공하거나 보증하는 것이 아닙니다. 자세한 내용은 이용 약관을 참조하세요.