📍 Today’s Expected Range (Intraday Approximation)
Expected High: ₹1,403–₹1,410
Expected Low: ₹1,391–₹1,385
These are approximate intraday levels. Actual prices may fluctuate slightly due to market volatility.
🔍 Key Points
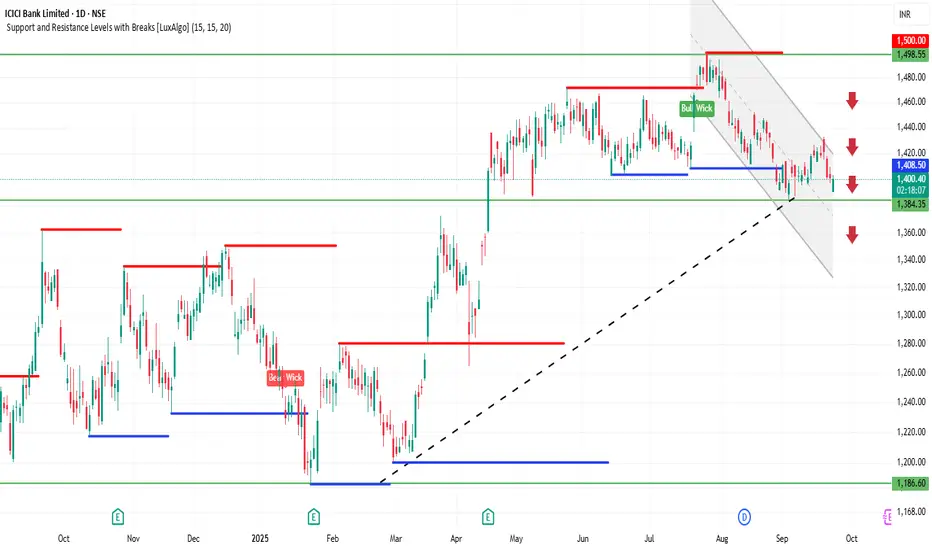
Current price: ₹1,400–₹1,401, close to resistance.
If price breaks above ₹1,410 with strong volume → bullish momentum likely.
If price drops below ₹1,385 → short-term correction or pullback possible.
📊 Suggested Trading Strategy
Bullish Scenario
If ICICI Bank breaks ₹1,403–₹1,410, you can buy, targeting ₹1,420–₹1,430.
Stop-loss: ₹1,395
Bearish Scenario
If ICICI Bank drops below ₹1,385, you can sell/short, targeting ₹1,375–₹1,370.
Stop-loss: ₹1,390
Range-Bound / Sideways
If price trades between ₹1,385–₹1,403, it’s better to wait and avoid trading until a clear breakout occurs.
💡 Summary
Resistance Zone: ₹1,403–₹1,410
Support Zone: ₹1,385–₹1,391
Strategy: Trade in the direction of the breakout, and always use stop-loss to manage risk.
Expected High: ₹1,403–₹1,410
Expected Low: ₹1,391–₹1,385
These are approximate intraday levels. Actual prices may fluctuate slightly due to market volatility.
🔍 Key Points
Current price: ₹1,400–₹1,401, close to resistance.
If price breaks above ₹1,410 with strong volume → bullish momentum likely.
If price drops below ₹1,385 → short-term correction or pullback possible.
📊 Suggested Trading Strategy
Bullish Scenario
If ICICI Bank breaks ₹1,403–₹1,410, you can buy, targeting ₹1,420–₹1,430.
Stop-loss: ₹1,395
Bearish Scenario
If ICICI Bank drops below ₹1,385, you can sell/short, targeting ₹1,375–₹1,370.
Stop-loss: ₹1,390
Range-Bound / Sideways
If price trades between ₹1,385–₹1,403, it’s better to wait and avoid trading until a clear breakout occurs.
💡 Summary
Resistance Zone: ₹1,403–₹1,410
Support Zone: ₹1,385–₹1,391
Strategy: Trade in the direction of the breakout, and always use stop-loss to manage risk.
관련 발행물
면책사항
해당 정보와 게시물은 금융, 투자, 트레이딩 또는 기타 유형의 조언이나 권장 사항으로 간주되지 않으며, 트레이딩뷰에서 제공하거나 보증하는 것이 아닙니다. 자세한 내용은 이용 약관을 참조하세요.
관련 발행물
면책사항
해당 정보와 게시물은 금융, 투자, 트레이딩 또는 기타 유형의 조언이나 권장 사항으로 간주되지 않으며, 트레이딩뷰에서 제공하거나 보증하는 것이 아닙니다. 자세한 내용은 이용 약관을 참조하세요.