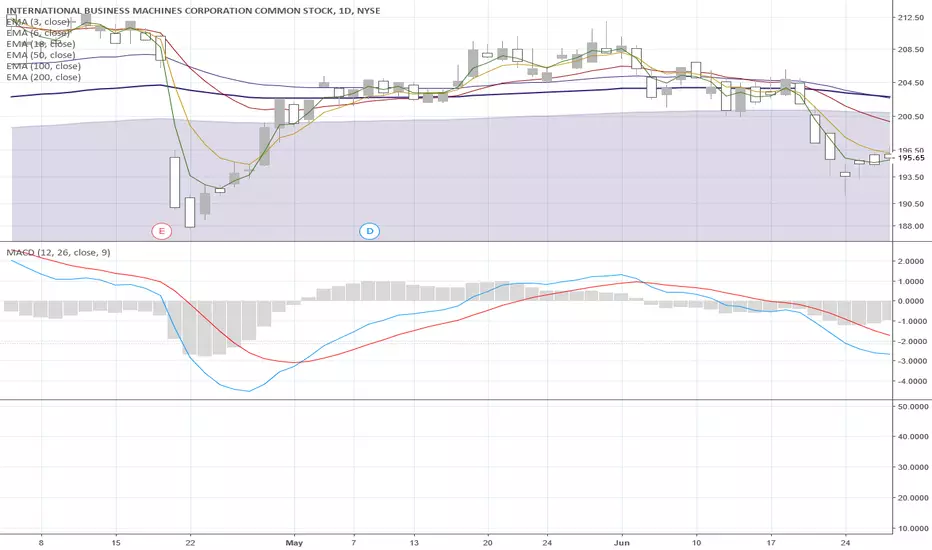
In the candlestick chart at the top you'll see daily interval prices of IBM corporation with a layover of the 12 and 26 period exponential moving averages. In the lower portion of the chart you'll see the MACD indicator, the slower 'trigger line' or 9 period Simple moving average, and the zero line around which the first two oscillate.
The typical default parameters for the MACD are most commonly 12/26/9, meaning the MACD plots the difference between the 12 and 26 (12-26) Exponential moving averages. The 9 parameter represents the 9-period Simple moving average of the MACD calculation.
The typical default parameters for the MACD are most commonly 12/26/9, meaning the MACD plots the difference between the 12 and 26 (12-26) Exponential moving averages. The 9 parameter represents the 9-period Simple moving average of the MACD calculation.
면책사항
해당 정보와 게시물은 금융, 투자, 트레이딩 또는 기타 유형의 조언이나 권장 사항으로 간주되지 않으며, 트레이딩뷰에서 제공하거나 보증하는 것이 아닙니다. 자세한 내용은 이용 약관을 참조하세요.
면책사항
해당 정보와 게시물은 금융, 투자, 트레이딩 또는 기타 유형의 조언이나 권장 사항으로 간주되지 않으며, 트레이딩뷰에서 제공하거나 보증하는 것이 아닙니다. 자세한 내용은 이용 약관을 참조하세요.