This is a chart that I sent to my members today.
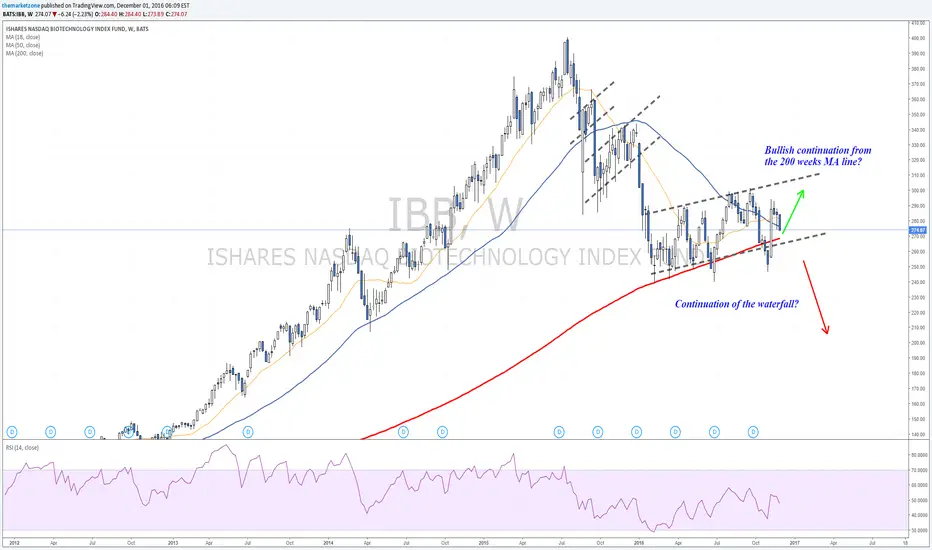
It presents two potential trades on IBB:
1. Bullish (short term) setup - 270$ is the key zone as it presents a weekly support zone.
2. Bearish continuation (based on longer term analysis) - Continuation of the the waterfall that started on May 2015.
Waiting to here your thoughts.
It presents two potential trades on IBB:
1. Bullish (short term) setup - 270$ is the key zone as it presents a weekly support zone.
2. Bearish continuation (based on longer term analysis) - Continuation of the the waterfall that started on May 2015.
Waiting to here your thoughts.
노트
Despite Trump's comments, IBB holds the bottom of the channel. 270$ is nearest support.
면책사항
이 정보와 게시물은 TradingView에서 제공하거나 보증하는 금융, 투자, 거래 또는 기타 유형의 조언이나 권고 사항을 의미하거나 구성하지 않습니다. 자세한 내용은 이용 약관을 참고하세요.
면책사항
이 정보와 게시물은 TradingView에서 제공하거나 보증하는 금융, 투자, 거래 또는 기타 유형의 조언이나 권고 사항을 의미하거나 구성하지 않습니다. 자세한 내용은 이용 약관을 참고하세요.