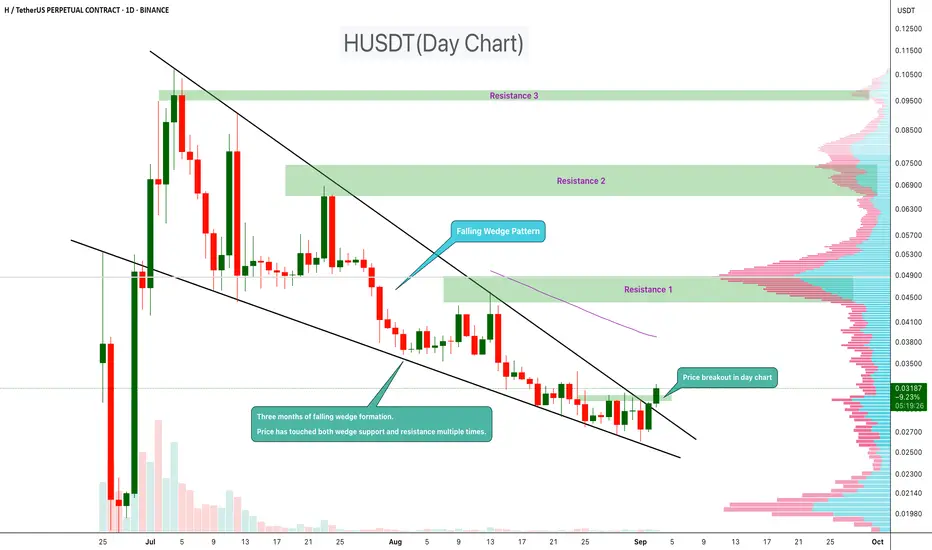
HUSDT has been forming a falling wedge pattern over the past three months. During this period, the price has tested both the wedge support and resistance multiple times, confirming the structure.
Now, a breakout has appeared on the daily chart, suggesting that bullish momentum may be building. Falling wedges are typically seen as reversal patterns, often leading to upside continuation once the breakout is confirmed.
Resistance 1:$0.045
Resistance 2:$0.066
Resistance 2:$0.095
cheers
Hexa
Now, a breakout has appeared on the daily chart, suggesting that bullish momentum may be building. Falling wedges are typically seen as reversal patterns, often leading to upside continuation once the breakout is confirmed.
Resistance 1:$0.045
Resistance 2:$0.066
Resistance 2:$0.095
cheers
Hexa
액티브 트레이드
50%+ profit
🚀Telegram : t.me/hexatrades
🌐Website: hexatrades.io/
🗣️Twitter(X): twitter.com/HexaTrades
🌐Website: hexatrades.io/
🗣️Twitter(X): twitter.com/HexaTrades
관련 발행물
면책사항
이 정보와 게시물은 TradingView에서 제공하거나 보증하는 금융, 투자, 거래 또는 기타 유형의 조언이나 권고 사항을 의미하거나 구성하지 않습니다. 자세한 내용은 이용 약관을 참고하세요.
🚀Telegram : t.me/hexatrades
🌐Website: hexatrades.io/
🗣️Twitter(X): twitter.com/HexaTrades
🌐Website: hexatrades.io/
🗣️Twitter(X): twitter.com/HexaTrades
관련 발행물
면책사항
이 정보와 게시물은 TradingView에서 제공하거나 보증하는 금융, 투자, 거래 또는 기타 유형의 조언이나 권고 사항을 의미하거나 구성하지 않습니다. 자세한 내용은 이용 약관을 참고하세요.