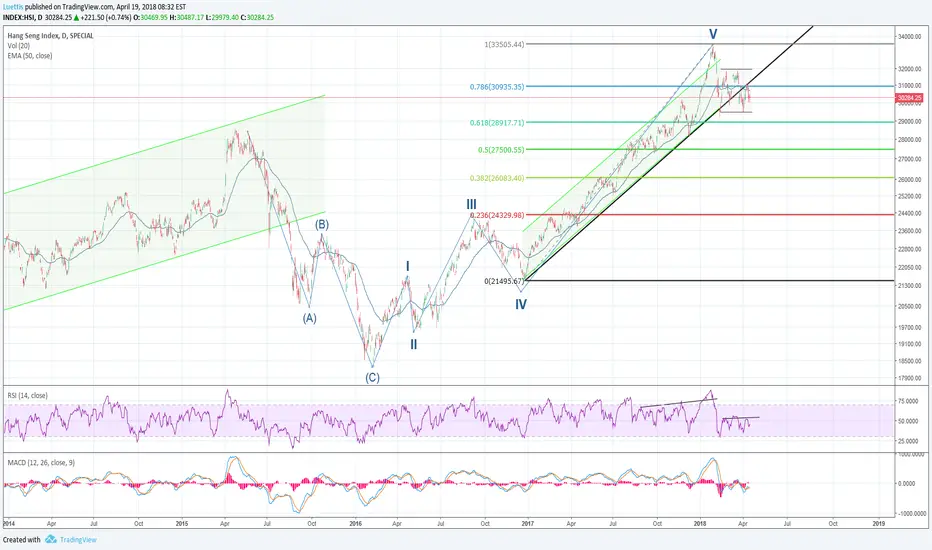
HSI has reached ATH at 33484 on jan 29. Probably it was the end of wave 5.
After having passed the ATH it fell down on to the lower limit of the existing ascending trend channel.
In the next weeks this limit has been tested till it broke to the bottom.
We can now analyse that the new trend was installed when the index fell on the lower limit of the old trend channel. And we´re in a neutral trend channel with high volatility now.
The fib retracement 78.6% at 30.935 is the actual resistance.
RSI is below 50 with a little positive trend but MACD is negative and trigger line is just about to cross the signal line.
= negative sign
In my view the market is nervous and could surprise the investors with unexpected movements.
Time to take profits and to be cautios.
HSI would show new bullish signs when a) the resistance is taken and b) the upper limit of the trend channel is broken to the top
액티브 트레이드
노트
Within the trend channel the index formed a diamond pattern. And it seems that is has gone to the bottom. If the lower limit of the trend channel is broken to the bottom, then the index will probably continue its downtrend at least to 29.000 pt (fib retracement 61,8%).
If the index breaks the little descending trend line to the top we´ll see higher prices.
But until the fib retracement 78.6% isn´t broken to the top, the situation remains weak.
면책사항
이 정보와 게시물은 TradingView에서 제공하거나 보증하는 금융, 투자, 거래 또는 기타 유형의 조언이나 권고 사항을 의미하거나 구성하지 않습니다. 자세한 내용은 이용 약관을 참고하세요.
면책사항
이 정보와 게시물은 TradingView에서 제공하거나 보증하는 금융, 투자, 거래 또는 기타 유형의 조언이나 권고 사항을 의미하거나 구성하지 않습니다. 자세한 내용은 이용 약관을 참고하세요.