Hang Seng Index Hits 4-Year High
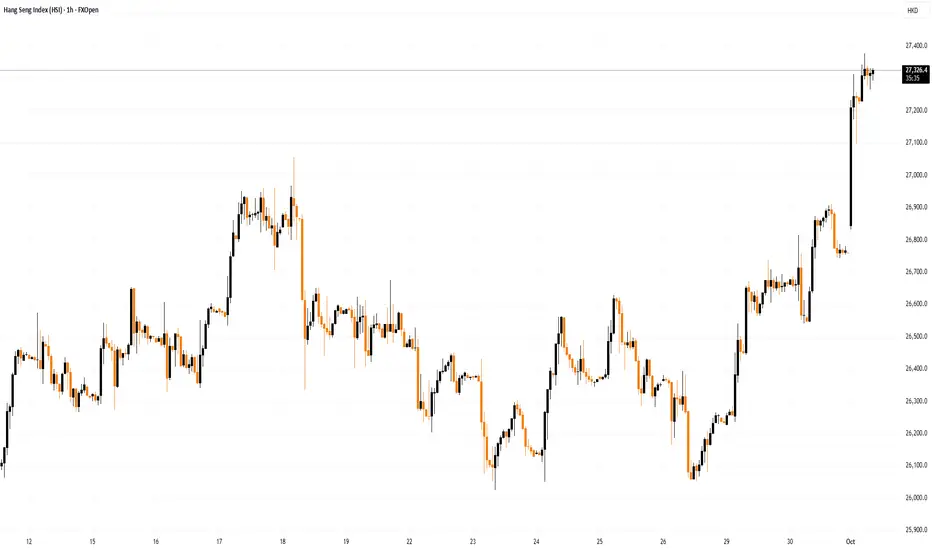
As the chart shows, Hong Kong’s Hang Seng Index climbed above the 27,300 mark today – for the first time since summer 2021. The bullish momentum has been supported in part by corporate news. According to media reports:
→ Shares of Chinese EV maker NIO Inc. rose by around 5% following news that vehicle deliveries had increased by 64.1% year-on-year.
→ Shares of Ascletis Pharma Inc. jumped 12.8% after the company announced a share buyback programme.
→ Alibaba shares surged 4% after JPMorgan raised its price target by more than 40%, citing AI industry development and strong user engagement.
Since 1 September, the Hang Seng Index has gained over 7%.

Technical Analysis of the Hang Seng Index Chart
In our 23 September review of the index chart, we:
→ highlighted that the price had fallen to the lower boundary of the blue ascending channel;
→ noted signs of demand emerging around the psychological 26,000 level.
Since then (as shown by the arrow), price action has been supported by these levels. On 26 September, bears attempted once more to break below 26k, but failed – giving bulls the opportunity to seize control. This resulted in the formation of a steep upward trajectory, highlighted in orange.
From an optimistic perspective:
→ The market has resumed its uptrend, breaking above the corrective bull flag pattern (shown in red).
→ The September high near the psychological 27,000 level was broken decisively — the long candlestick points to a demand–supply imbalance favouring buyers, reinforcing the relevance of the bullish Fair Value Gap pattern highlighted in purple.
→ The price is now trading in the upper half of the blue channel (a sign of strong demand).
At the same time, the RSI indicator has entered the overbought zone. Once the first wave of positive sentiment fades, a bout of profit-taking could happen, which might trigger a correction — potentially involving a retest of the 27k level or the lower orange line.
This article represents the opinion of the Companies operating under the FXOpen brand only. It is not to be construed as an offer, solicitation, or recommendation with respect to products and services provided by the Companies operating under the FXOpen brand, nor is it to be considered financial advice.
As the chart shows, Hong Kong’s Hang Seng Index climbed above the 27,300 mark today – for the first time since summer 2021. The bullish momentum has been supported in part by corporate news. According to media reports:
→ Shares of Chinese EV maker NIO Inc. rose by around 5% following news that vehicle deliveries had increased by 64.1% year-on-year.
→ Shares of Ascletis Pharma Inc. jumped 12.8% after the company announced a share buyback programme.
→ Alibaba shares surged 4% after JPMorgan raised its price target by more than 40%, citing AI industry development and strong user engagement.
Since 1 September, the Hang Seng Index has gained over 7%.
Technical Analysis of the Hang Seng Index Chart
In our 23 September review of the index chart, we:
→ highlighted that the price had fallen to the lower boundary of the blue ascending channel;
→ noted signs of demand emerging around the psychological 26,000 level.
Since then (as shown by the arrow), price action has been supported by these levels. On 26 September, bears attempted once more to break below 26k, but failed – giving bulls the opportunity to seize control. This resulted in the formation of a steep upward trajectory, highlighted in orange.
From an optimistic perspective:
→ The market has resumed its uptrend, breaking above the corrective bull flag pattern (shown in red).
→ The September high near the psychological 27,000 level was broken decisively — the long candlestick points to a demand–supply imbalance favouring buyers, reinforcing the relevance of the bullish Fair Value Gap pattern highlighted in purple.
→ The price is now trading in the upper half of the blue channel (a sign of strong demand).
At the same time, the RSI indicator has entered the overbought zone. Once the first wave of positive sentiment fades, a bout of profit-taking could happen, which might trigger a correction — potentially involving a retest of the 27k level or the lower orange line.
This article represents the opinion of the Companies operating under the FXOpen brand only. It is not to be construed as an offer, solicitation, or recommendation with respect to products and services provided by the Companies operating under the FXOpen brand, nor is it to be considered financial advice.
면책사항
이 정보와 게시물은 TradingView에서 제공하거나 보증하는 금융, 투자, 거래 또는 기타 유형의 조언이나 권고 사항을 의미하거나 구성하지 않습니다. 자세한 내용은 이용 약관을 참고하세요.
면책사항
이 정보와 게시물은 TradingView에서 제공하거나 보증하는 금융, 투자, 거래 또는 기타 유형의 조언이나 권고 사항을 의미하거나 구성하지 않습니다. 자세한 내용은 이용 약관을 참고하세요.