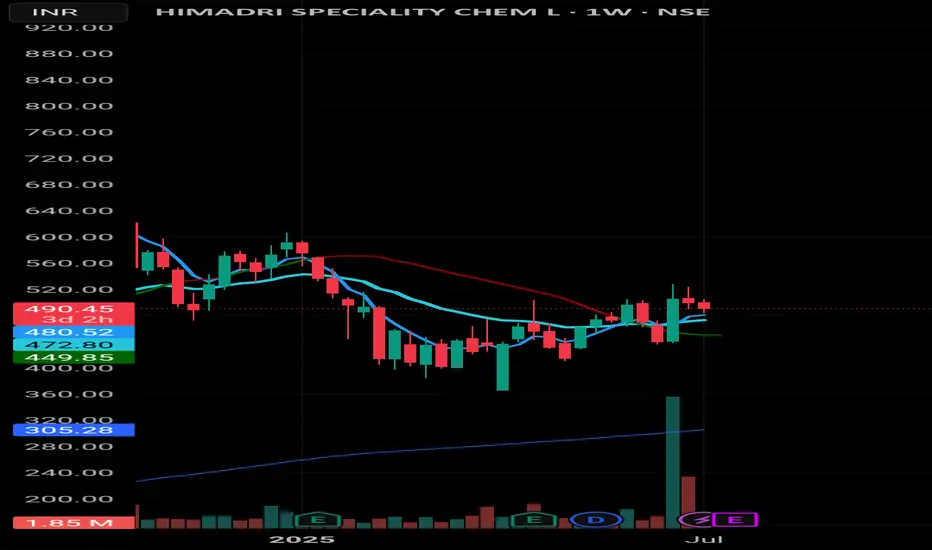
📊 Himadri Speciality Chem – Weekly Chart Update
• Strong volume breakout recently, with price hovering around 480–490 zone
• Price facing resistance near 200 EMA (red line) at ~487.70
• Support zones:
– 472.55 (20 EMA)
– 449.70 (50 EMA)
• Weekly candle formation hints at indecision. Watch next move for breakout or fade.
🎯 Plan Ahead:
If sustains above 488–490, potential upmove towards 520+
If breaks 472, expect retracement till 450–455 range
🔁 Trend is your friend, till it bends.
Not financial advice—just chart reading. Stay sharp. 💹
#Himadri #SwingTrade #PriceAction #VolumeBreakout #NSE #WeeklyAnalysis #TechnicalSetup
Started like everyone else — chasing trends, ignoring risk.
Learned the hard way that survival beats prediction.
Now I share structured equity views and hedged options plays using Renko and macro context — built for consistency, not dopamine.
Learned the hard way that survival beats prediction.
Now I share structured equity views and hedged options plays using Renko and macro context — built for consistency, not dopamine.
면책사항
이 정보와 게시물은 TradingView에서 제공하거나 보증하는 금융, 투자, 거래 또는 기타 유형의 조언이나 권고 사항을 의미하거나 구성하지 않습니다. 자세한 내용은 이용 약관을 참고하세요.