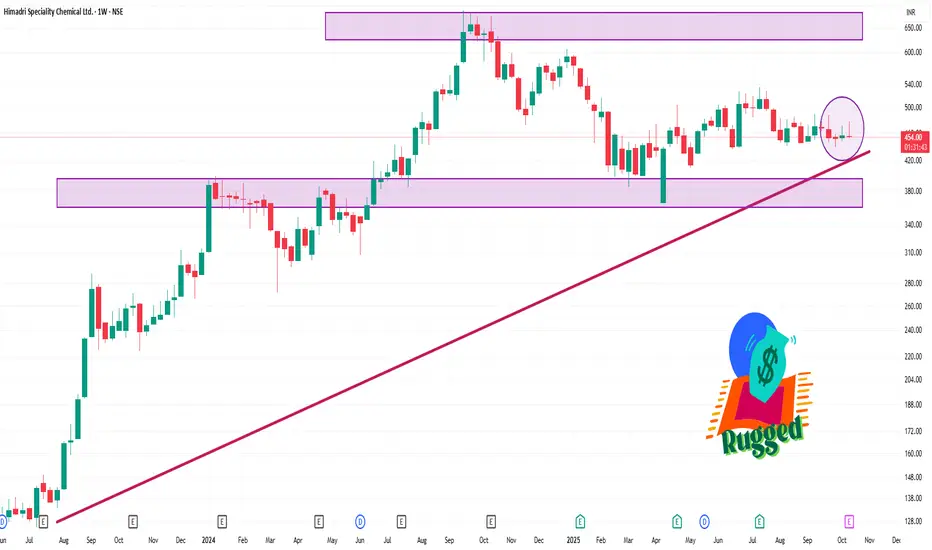
📊 1-Week Technical Overview
Price Change: HSCL has gained approximately 3.35% over the past week.
Day Range: ₹458.60 – ₹469.55
52-Week Range: ₹365.35 – ₹676.20
Volume: 535,912 shares traded
📈 Technical Indicators
Relative Strength Index (RSI): 36.75, suggesting a neutral to slightly oversold condition.
Moving Averages: Short-term (5-day) and medium-term (50-day) moving averages indicate a neutral to slightly bearish outlook.
MACD: The Moving Average Convergence Divergence indicator is negative, reinforcing a bearish sentiment.
관련 발행물
면책사항
해당 정보와 게시물은 금융, 투자, 트레이딩 또는 기타 유형의 조언이나 권장 사항으로 간주되지 않으며, 트레이딩뷰에서 제공하거나 보증하는 것이 아닙니다. 자세한 내용은 이용 약관을 참조하세요.
관련 발행물
면책사항
해당 정보와 게시물은 금융, 투자, 트레이딩 또는 기타 유형의 조언이나 권장 사항으로 간주되지 않으며, 트레이딩뷰에서 제공하거나 보증하는 것이 아닙니다. 자세한 내용은 이용 약관을 참조하세요.